
Organizations rely on multiple servers such as core app servers, database servers, web servers, and caching servers for daily communication and critical business operations. Servers are the most crucial elements of the IT infrastructure as they’re mainly used to manage resources in a network. A server failure can lead to costly server crashes with a massive impact on workflows, client files, and deadlines, affecting the business’s bottom line. Therefore, tracking the performance of each server is imperative. Server monitoring helps organizations to proactively detect issues at early stages and fix them before they turn into serious threats. It provides detailed and intensive reports on capacity planning and ensures the servers (physical and virtual) are operational, active, and healthy.
What Is Server Monitoring?
The basic concept of server monitoring is to ensure the entire server infrastructure, including servers, applications, devices are running at its peak without any hiccups. Effective server monitoring helps system administrators to track server performance data, proactively identify vulnerabilities, and resolve any server issues. It involves monitoring of different aspects of a network/server infrastructure. The operating system, server hardware, network traffic, applications running on the operating system, memory and disk utilization, and CPU usage are a few components monitored using server monitoring. Moreover, hardware monitoring is also possible to ensure all the devices are working as expected. Monitoring is accomplished by alerting when the critical events reach or exceed the threshold value set for different elements. Alerting helps admins to take quick actions and prevent future issues.
- Creates dependency maps between systems to check for potential vulnerabilities
- Advanced server monitoring notifies admins about issues by sending alerts
- Event handlers to automatically restart failed services
- Centralized view of infrastructure
- Trending and capacity planning tools
Advantages of Server Monitoring
Keeping a tab of the organizational mission-critical networking elements help teams to spot and fix issues faster, even before they get worse. Listed below are a few advantages of server monitoring.
- Faster Issue Resolution
- Gain Immediate ROI
- Identify Security Threats
- Manage Networks
- Equipment Upgrades
- Report on SLAs
- Stay Proactive
Faster Issue Resolution
Server monitoring makes the problem-solving faster even at times of server slowdowns. Whether system admins are dealing with unusual traffic fluctuation or configuration error, server monitoring provides full support in finding out the root cause of the issues. Moreover, live server maps help to find the root cause of problems, and the status window displays a detailed view of the server performance. Server monitoring tools not only helps with identifying issues, but also helps in resolving the issues faster with automation without involving relevant teams.
Gain Immediate ROI
Server administrators have to deal with complex projects and heavy workloads without having the actual budget, resources, and time required to accomplish them. With server monitoring tools, teams don’t have to get manually involved in the determination of server performance and related issues. Instead, these tasks are automated. The employees and resources can be utilized for sensitive projects. This not only helps in cutting down the costs of outages and the time involved in resolving the issues but also delivers immediate ROI.
Identify Security Threats
Security threat is one of the major concerns of the organizations. They need a tier 1 method to protect their assets from data breaches. The server monitoring tool is of great help. It not only provides first-level security to the business but also helps in identifying potential security threats and resolving them before they get even worse. Server monitoring tools are capable of spotting even the smallest flow, including an unusual increase in traffic levels or the introduction of unfamiliar devices into the network. With this information, teams can quickly figure out the exact events and the devices on which they’ve occurred and take proactive measures to fix them.
Manage Networks
With growing technology and IT environments, it’s becoming difficult to manage organizational networks. The number of network components connected to the internet is rising, such as sensors, wireless devices, or cloud technologies. Its number will reach 20.4 billion by the end of 2020, as per the Gartner report. Growing networks are also increasing complexity. Therefore, monitoring these devices and changing networks for suspicious activity isn’t only important but also challenging. It’s crucial to use flexible and reliable tools while using cloud migrations or IPv6 transitions. The tools monitor all the IP assets for major fluctuations and try resolving them without manual involvement.
Equipment Upgrades
Equipment upgrades are of great importance. Upgrades help businesses to scale and keep their equipment up to date at times when organization and technology grows. Historical data of how various devices and equipment have been performing from the last few months can help to upgrade the entire system as per the growing trend. Server monitoring tools have the ability to provide historical insights into the performance of various devices and equipment used in the organization over time. Trend analysis helps businesses in the determination of whether the existing technology can be upscale to meet the specific business requirements or the businesses need to implement new technologies.
Report on SLAs
Service Level Agreement (SLA) is of great importance, which is created between the vendor and the organization. It states the best services a vendor can offer. Some vendors provide SLA reports to ensure clients all promises are kept. SLA reports include network monitoring metrics such as the total uptime the client can expect, help desk response time to resolve specific issues, and the number of concurrent users the internet service provider supports.
Stay Proactive
Staying proactive means being aware of possible server issues before they occur. These issues can be a result of environmental factors, human errors, configuration issues, and more. When organizations implement a server monitoring tool, teams can proactively take protective measures against the occurrence of server related-issues. Advanced monitoring tools provide visibility into devices and networks through live maps and easy-to-read interface, so teams can identify the reasons for outages and stay ahead of potential issues.
Types of Server Monitoring
The introduction of new technologies has helped organizations to improve their efficiency and productivity. However, the massive dependency on technology (if not handled properly) can be one of the reasons for system failure. It can lead to slow business operations, huge losses, can affect an organization’s reputation, and disappoint customers and users. Server monitoring includes dozens of components to be broken into the following aspects.
- Database Monitoring
- Uptime Monitoring
- Log Monitoring
- Performance Monitoring
- Resource Monitoring
- Security Monitoring
- Error Monitoring
Database Monitoring
Database servers are the second-most important components of the system after the web servers. It’s important to track database servers to minimize downtime. Database monitoring refers to the tracking of database resources and their performance, so crucial applications can be made available at all times. Maintaining database-specific levels helps to keep the servers running throughout. For instance, monitoring of SQL Server, MySQL, and Oracle include the analysis of the following categories to minimize and prevent database outages.
- Session details of each user
- Query details like CPU utilization
- Replication details
- Scheduled jobs
- Database performance such as buffer, lock, cache, connection, and latch
Uptime Monitoring
Uptime monitoring ensures the organizational servers are always available. It’s useful in measuring the reliability and stability of various resources and devices. However, managing a large number of servers and checking them for network issues, malware attacks, and hard disk failures can be difficult. Even seconds of downtime can cause huge losses depending on the size and impact of the server. Uptime monitoring can help teams receive notifications before an event occurs. Thereby preventing server downtime.
Log Monitoring
Logs can be defined as the series of messages defining the activities within a system. These are generated by a wide range of programmable technologies, including applications, servers, and operating systems. Log monitoring helps to collect and analyze these logs for various events such as server performance issues, network downtime, and more. This is typically done using log monitoring software to notify relevant teams about the events in the form of emails, SMS, push notifications, and alerts.
Performance Monitoring
Performance monitoring can be defined as a process of verifying and tracking how fast and consistently the organizational applications, servers, and digital platforms are running. As the cloud services are primarily distributed across different locations, it becomes challenging to track their performance. Performance monitoring tools are required to be able to trace various elements within a network. Dedicated performance monitoring tools help to measure latency, bottlenecks in the server and network. These tools include customizable dashboards with a real-time performance view of devices, networks, and servers. It also consists of an alerting system to notify teams about the server slowdowns and failures.
Resource Monitoring
The performance of the server hugely depends on its several physical components. Resource monitoring helps server administrators to check and track the performance of the individual components such as RAM, hard disk, and processor. With resource monitoring, teams can drill down to specific metrics of resources such as CPU utilization, voltage, and temperature to understand how they are performing. Moreover, these metrics warn you about network slowdowns and server failure.
Security Monitoring
Security monitoring refers to the collection and analysis of information required to detect the suspicious behavior of the devices. It also helps teams to find out any unauthorized system changes in the organizational network. With security monitoring tools, teams can trigger alerts based on server behavior and take actions accordingly. Besides tracking and reporting on suspicious activity, security monitoring also helps to keep an eye on login credentials, the number of password attempts, track machine faults, and more. The level of monitoring controls needed highly depends on the size of the network. Therefore, organizations need to choose a monitoring tool to best suits their requirements.
Error Monitoring
Digging through log files, data stamps, and support tickets to find the cause of server errors is time-consuming. Error monitoring helps to provide a detailed diagnostic view for each server error. Using error monitoring tools, teams are notified about errors through email, SMS, code hooks, and more. The tools also help to find out the number of times the errors occur, so engineers can plan a strategy and deploy it faster to debug problems quickly. Error monitoring improves customer experience, reduces revenue losses, and increases developer productivity.
Top Server Monitoring Tools
Server monitoring tools are available in two different versions for small, medium, and large enterprises. The first are the open-source tools, free of cost, but often requiring significant investments to install, configure, learn, and use. Security is another important business requirement open-source tools are unable to meet. The second option businesses can choose are the commercial or paid server monitoring tools. These tools charge a subscription fee according to different pricing plans and the myriad of features a business chooses. These plans can also be customized as per the specific requirements. The commercial tools offer free trials with standard features to help businesses get an idea of their functionality. Tools like SolarWinds® Server & Application Monitor provide complete and comprehensive information about servers, applications, devices, in a single panel. Listed below are the top open-source and commercial tools designed to help teams with their server monitoring requirements.
1. SolarWinds Server & Application Monitor
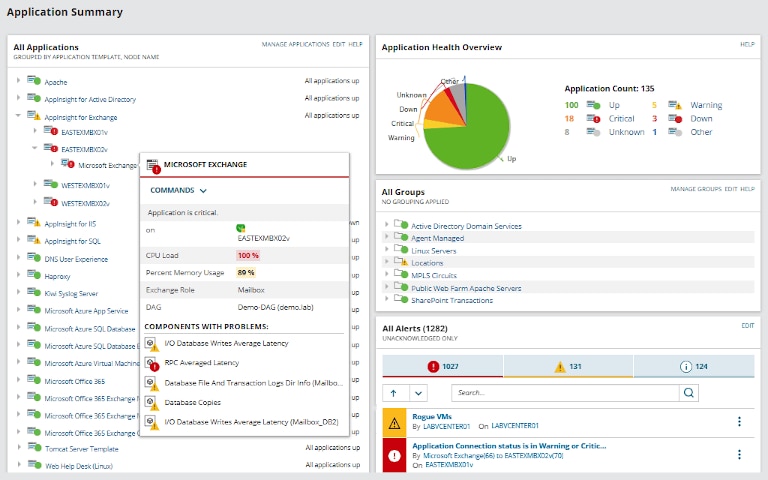
SolarWinds Server & Application Monitor (SAM) is an easy-to-use and cost-effective server monitoring solution. This tool helps to provide deep visibility into various applications, servers, and devices for performance issues. SAM offers more than 1,200 monitoring templates to provide end-to-end visibility across private, public, and hybrid cloud environments. These templates are a blueprint referred to as a collection of components designed specifically to monitor various servers and applications. It allows teams to stay proactive by receiving alerts about issues, responding to them, and fixing problems quickly. The tool is capable of checking latency issues and the reasons for packet loss. It helps to minimize downtime by using prepackaged monitoring templates, alerts, and reports. SolarWinds SAM can access monitoring information through agentless and agent-based monitoring via SNMP and WMI protocols.
Features of SAM include:
- Out-of-the-box support for over 200 applications
- Automatic mapping and discovery of applications and dependencies
- 800-plus custom user generate monitoring templates
- Cloud monitoring including Microsoft Azure, Amazon EC2, and Rackspace
- Granular monitoring of memory (RAM), critical services, CPU/processor usage, hard disk usage, and hardware used within the server
- AppInsight™ feature for intrinsic visibility into specific Microsoft Processes
You can download a free 30-day trial of SAM here.
2. Nagios Core
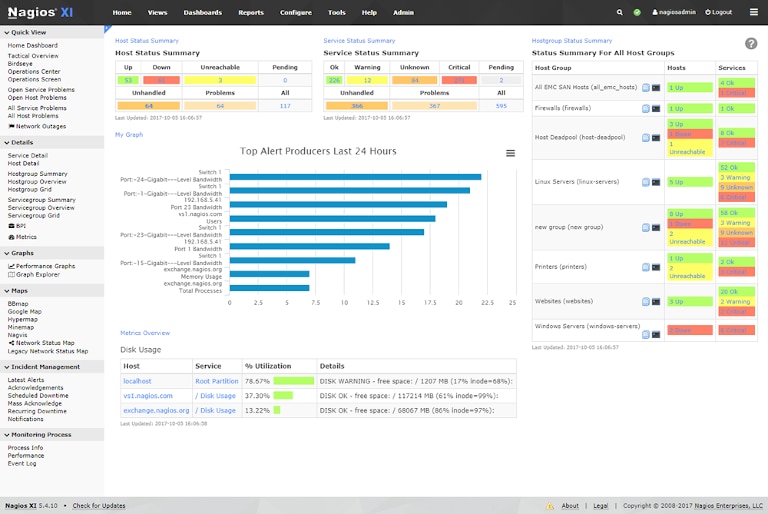
Nagios is an open-source server and network monitoring tool. Nagios comes in these different models, all with different sets of features to support system administrators:
- Nagios XI
- Nagios Core
- Nagios Fusion
- Nagios Network Analyzer
Nagios XI has monitoring capabilities. It’s used to visualize various server performance metrics, representations, and reports. Nagios monitoring tools come with enhanced auto-discovery features designed to help find inactive devices within the network. It notifies respective teams by sending alerts. The tool generates comprehensive reports based on the information collected about server performance, events, and existing devices in the network. As compared to other monitoring tools, the Nagios server monitoring tool is fast in the detection of network outages and protocol failures. Initially, it can be complicated to install, set up, and use, but once it’s done, the tools offer immediate services. Nagios Core, being a free tool, offers limited monitoring capabilities. It’s recommended to choose Nagios XI, a commercial tool, to use added features and functionalities like custom dashboards and reporting systems.
3. Ganglia
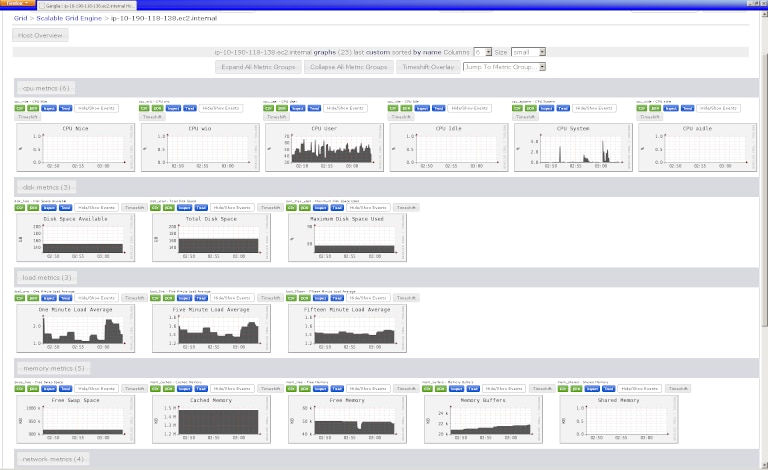
Ganglia is an open-source and scalable monitoring system used to monitor a large number of servers for their real-time performance. Ganglia has a hierarchical design and is made of the following components:
- Gmond is a Ganglia monitoring system to collect node information.
- Gmetad is a Ganglia meta daemon on master node used to collates data from Gmond daemons
- Round Robin Database (RRD) is a master node tool used to store and visualize Ganglia data in time series
- PHP is a front-end web interface on the master node used to display important metrics in the form of graphs and charts
It also uses XML for data representation and XDR for the transportation of data. Ganglia organizes nodes or the monitoring machines in the form of clusters or groups. On a broader level, these clusters can be organized into grids. This helps to engineer data structures and algorithms, so the tool can achieve maximum results and efficiency of each node. Ganglia is a powerful server monitoring system supporting a huge number of operating systems and processors around the world.
4. ManageEngine OpManager
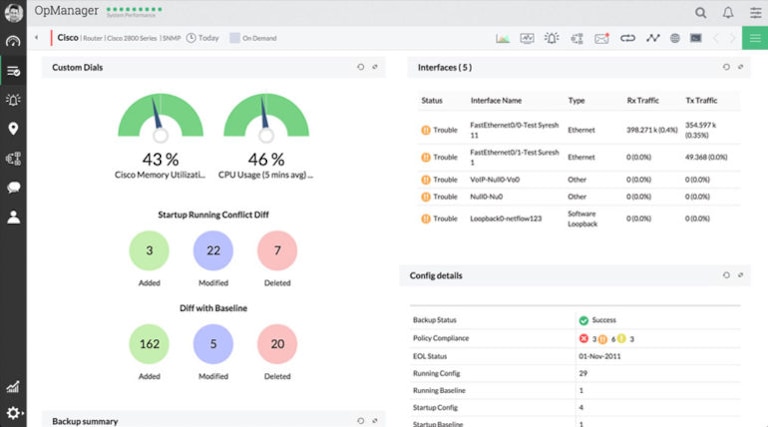
ManageEngine OpManager is a server monitoring system used to monitor various parameters such as CPU utilization, memory capacity, available memory, device response time, total/free disk space, memory utilization, and disk read/write. It’s also capable of monitoring the real-time performance of Windows systems, generating in-depth performance reports, and setting critical and warning threshold limits. The tool provides multivendor support to monitor critical applications continuously. It uses SNMP and WMI protocols to ensure the monitoring is done 24/7 throughout without any pause. It helps to proactively:
- Monitor servers with multi-level thresholds
- Monitor application performance
- Monitor VMware ESX servers and Guest OS performance
- Monitor Windows event log monitoring
- Monitor URL and website monitoring
The features of ManageEngine OpManager includes:
- Bandwidth and firewall log analysis
- Network health and Server overview and monitors
- VM and VOIP functionality
- Configuration management
5. CollectD
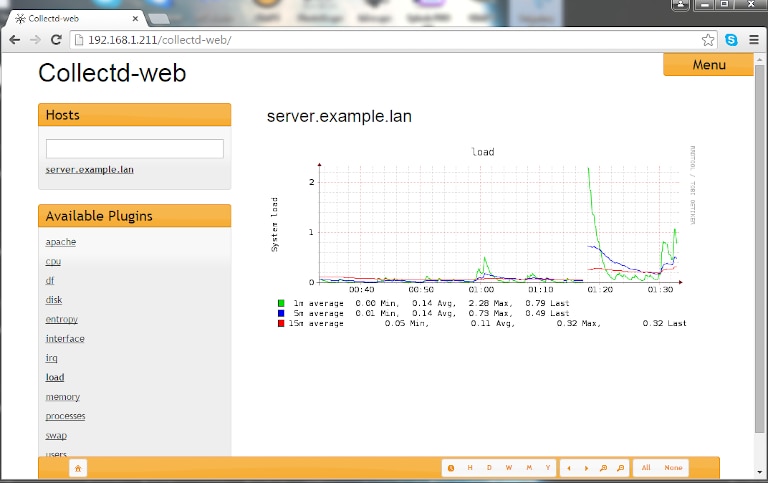
CollectD is a Unix open-source daemon designed to collect performance metrics from the computer systems and network equipment over time. It transfers and stores information in multiple formats, such as the RRD files used by Cacti, to generate data graphs. The performance data collated from multiple sources help administrators to maintain the records on available resources and detect network and server anomalies. CollectD is written in C++ and uses several plugins to collect crucial data about essential system metrics such as CPU and memory. CollectD helps to predict system loads and notify teams by sending custom alerts. The most common usage of this tool can be seen in DevOps projects as a collection agent. Features of CollectD includes:
- High-resolution statistics
- Modularity / Portability
- Sophisticated network code
- Custom extensions
- SNMP support
- Integration with monitoring solutions
6. Zabbix
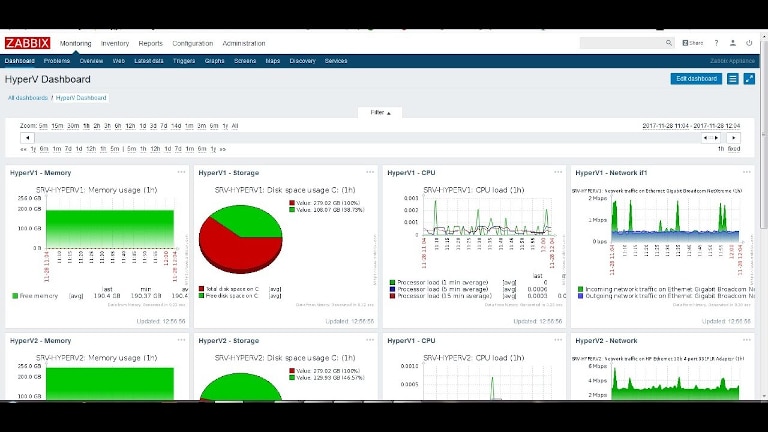
Zabbix is an open-source server monitoring tool used to monitor diverse IT components such as servers, networks, hardware, software, virtual machines, cloud services, and more. It provides performance monitoring metrics regarding disk space consumption, network utilization, and CPU load. Zabbix can be deployed for agents and agentless monitoring. It can monitor operations on operating systems such as Hewlett Packard Unix (HP-UX), Linux, Mac OS X, and Solaris without any agents. While Windows monitors for information like temperature, you can measure fan speed through agents like IPMI which must be installed on the target device before use. Data is stored in database platforms such as MySQL, Oracle, PostgreSQL, and SQLite. The information gathered is included in reports or is presented visually using Zabbix’s Graphical User Interface (GUI). Users can view these in-depth reports in the form of widgets, network maps, graphs, slideshows through their customizable dashboards. The templates consist of custom-built add-ons to extend the functionalities of Zabbix. These templates enable users to monitor network devices from vendors such as Cisco, Juniper, HP, and Dell. Zabbix uses three different discovery modes:
- Network discovery
- Low-level discovery
- Auto-discovery
How to Choose the Right Server Monitoring Tool
The server monitoring tools highlighted above are great open-source and commercial tools for organizations. However, deciding on which tool is apt for your organization depends on the team’s requirements. Each commercial tool mentioned above offers a free trial version with all the standard features. We advise you to try a free trial of SolarWinds Server & Application Monitor as it comes with unique features and functionalities such as custom app monitoring, application monitoring, and application dependency mapping apt for organizational server monitoring. The tool provides valuable information about your servers, applications, and devices with the ability to provide at-a-glance reports.