
Today most businesses have a significant digital footprint and some rely heavily on their web applications for delivering value to their customers and generating revenues. In this competitive digital environment, ensuring your website remains live 24/7 isn’t enough. You need to optimize your web pages regularly to deliver a better experience. Slow performing pages or those lacking mobile optimization can not only lead to increased bounce rate but can also impact your search engine rankings. In this article, we’ll discuss how you can monitor your website’s performance and make it faster using the best practices and web performance monitoring tools.
What Is Web Performance Monitoring?
Web performance monitoring refers to the set of practices and tools helping you monitor your web application using various metrics and technical parameters affecting the page load speeds and user experience. Most web performance analyzers help you check website status or uptime and track critical indicators such as page size, time to first byte, broken links, database performance, CPU utilization, and more. With the regular monitoring of your web applications, you can identify any lingering, hidden, or cyclical issues, and also get higher readiness to deal with unexpected spikes.
Web performance monitoring tools can also help you improve the “perceived performance” of your web pages, making them appear to load faster than they do. Lazy loading (loading images or other elements gradually as the user scrolls down a page, instead of loading the entire page in one go) used in modern image-heavy websites is a good example of perceived performance optimization. Modern web performance monitors also help you track user experience or UX-related cues such as page loading spinner, click and hover interactions, animations, scroll, and more.
How Fast Should Your Web Page Load?
When it comes to page load speed, there are several reports and guides, including this one from Google, which recommends page optimization for mobile as a high priority. According to Backlinko, which provides one of the most updated stats, the average web page loading time is around 87% higher on mobile as compared to desktop. It also states that –
“The average page loading speed (fully loaded) for a web page is 10.3 seconds on desktop and 27.3 seconds on mobile.”
The other major indicators measured by Backlinko are as follows:
- TTFB (Time to First Byte): 1.2 seconds (desktop) and 2.594 seconds (mobile)
- Speed Index: 4.782 seconds (desktop) and 11.455 seconds (mobile)
It should be noted, the overall page size has a significant impact on the page loading speed. You should consider compressing images and text to reduce the page size using Gzip.
Top Factors Affecting Web Performance
Server Performance
The performance of a web server directly impacts your website’s performance. Every time a browser pings your server, it’s requesting the server to load or transmit some data to your website. If your server is unhealthy, these requests take longer to process. In most cases, your hosting provider is responsible for maintaining the servers. If your website is using shared hosting and is regularly facing resource issues, you may consider switching the ISPs or choose a higher plan with more CPU, RAM, and disk space. In case you have a self-hosted setup, you can check out this guide for web server monitoring.
Server Location
Businesses spread across multiple geographies have to ensure the website performance remains consistent across all regions. However, if your website is hosted in one region (e.g., California), but receives traffic from other regions (e.g., Europe), the user experience across these regions will vary. In other words, the same page might load faster in the U.S. than in Europe. In such cases, you may consider implementing a CDN (content delivery network). A CDN is a network of additional server nodes spread across the world to ensure faster response times and reduced latency. These nodes usually cache static content from your website, including CSS and Javascript files, images, and other components.
Page Size
The ubiquitous availability of high-speed broadband and 4G mobile networks has made it possible for businesses to deliver better customer experience using rich multimedia content. Most customer-facing websites today include high-resolution images. As a result, the average physical size of web pages has also increased. However, as the page weight increases, it may take longer to load. To ensure your website pages load faster, all images and components need to be optimized or compressed wherever possible. Apart from compression, there are other techniques for optimizing the page size. For instance, instead of hosting video content on your servers, you can use any streaming service.
Scripting or Code-Related Issues
Every major website is built with thousands of lines CSS, HTML, and JavaScript code. As websites evolve, code density and complexity also increase. At many times, multiple scripts are running in parallel. In such situations, higher than expected web server calls can lead to increased latency. Also, multiple threads accessing the same shared code or files can lead to “race condition,” which can make a website vulnerable to security threats.
At many times, third-party scripts can also impact your page performance because the call to a remote server to run or load a script will take additional time. If the third-party service is experiencing an outage or increased load, it’ll take even longer to serve your website’s requests. Following the best practices in application development (e.g., minification of JavaScript, CSS, and HTML files, browser caching, etc.) and ensuring all scripts are properly optimized for speed and security will help you avoid such issues.
Faulty CMS Plugins
One of the benefits of using content management systems (CMS) is they offer numerous plugins, which prevent your development teams from reinventing the wheel. Though these plugins save significant time and effort in coding, they can also introduce a myriad of performance and integration-related challenges. Plugins built with older technologies or inefficient database queries can lead to higher load time. Further, free plugins are rarely updated and can have unpatched vulnerabilities. Development teams should consider limiting the use of plugins to as minimum as possible.
What Makes Web Performance Monitoring Difficult?
Complex Web Architectures
Today, most organizations are refactoring their traditional LAMP and MEAN stacks to leverage microservices and containers. This means modern application architectures are significantly different from what they used to be. These applications require analysis of a vast amount of data from different sources for troubleshooting. Traditional web monitoring tools for tracking availability and performance aren’t equipped to handle this complexity.
Lack of Proactiveness
Another major challenge most organizations face is IT teams often habituating to traditional processes and tools, which essentially offer a reactive approach to web performance management. In other words, teams are ready to respond to an issue but may lack tools and strategy to forecast and prevent the occurrence of such issues in the first place.
Lack of Intelligent Alerting
“Alert fatigue” isn’t an alien concept among IT administrators in large organizations. Most traditional tools require much time and effort for defining baselines or understanding how their website performs under different situations. Even when alerts are accurately configured, many times, issues can remain undetected as they fall under specific thresholds.
5 Best Practices for Web Performance Monitoring
- Monitoring Website Uptime Statistics
- Error Monitoring
- Monitoring of Key Transactions
- Application Dependency Monitoring
- Monitoring Metrics With RED Method
1. Monitoring Website Uptime Statistics
One of the first things you should check is whether your website is online and available to your users or not. One of the ways to check website status is via an HTTP ping monitor, which pings your website at defined periods. As long as you receive the 200 response code, you can rest assured the website is up and running. You can also analyze ping response times to identify any issues or spikes.
2. Error Monitoring
Whenever your application encounters issues, it creates errors. There are five categories of HTTP error codes (identified by the first digit of the code):
- 1xx: Informational
- 2xx: Success
- 3xx: Redirection
- 4xx: Client Error
- 5xx: Server Error
For instance, HTTP Error 500, which is one of the most common errors, indicates a web server is experiencing some internal issues which are leading to failures in request handling. While, this doesn’t tell you, much, if the error code is recurrent, you might want to dig deeper and troubleshoot such errors.
3. Monitoring of Key Transactions
There are certain web requests or transactions, which might be critical for your business operations. These requests will vary depending on the type of web application. For instance, an e-commerce application will differ significantly from a banking application. The types of services, APIs, and plugins involved in serving these transactions will also differ accordingly. You need to identify these critical transactions and ensure they’re monitored effectively.
You can monitor real user transactions with statistics showing the percentage of successful transactions along with the time they take. If you identify a sudden drop in success from the usual pattern, then you may conclude there’s a potential issue. Error logs will let you confirm the exact nature of the error. You can also monitor transactions synthetically using servers to simulate real-world conditions. This approach is useful for proactive planning and resolution of issues.
4. Application Dependency Monitoring
As organizations introduce new features to their web applications more frequently, it’s critical to monitor their performance in the live environment. Very often, application dependency issues arise as applications are moved from production and testing environments to the production environment. Modern tools supporting “distributed tracing” can help you identify the root cause of such issues in a microservices environment.
5. Monitoring Metrics With RED Method
Several tools offer out-of-the-box web performance metrics. Teams also add their custom metrics on top of them. In principle, all these metrics should help them get the big picture by getting an aggregated view of their environment. However, this approach can also lead to information overload. You need to shortlist some critical metrics to assess user experience and application health quickly.
RED metrics is a widely accepted method for monitoring three major web performance metrics:
- Rate – Requests served by the application per second
- Errors – Percentage of requests triggering an error
- Duration – Time taken by a request
For deeper analysis and troubleshooting, you may still need additional metrics from databases, external APIs, and more. However, if your application is running well, you might not need to monitor all such metrics perpetually.
Top 8 Tools for Web Performance Monitoring
1. GTmetrix
GTmetrix is one of the most popular commercial tools for monitoring website performance. It offers a wide range of features for detailed testing and analysis of a web application.
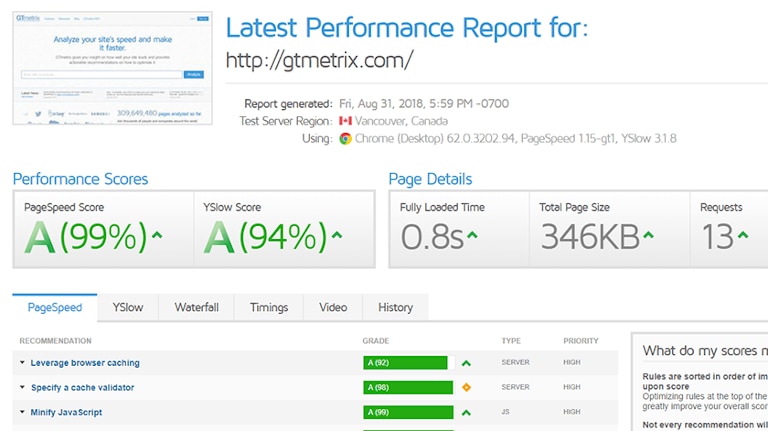
You can get a free performance report of your website to quickly asses how GTmetrix can help you measure your web performance. As can be seen in the screenshot above, it presents key indicators such as PageSpeed scores (Google), YSlow scores (Yahoo), fully loaded time, and total page size upfront. These scores are calculated from 25-plus servers in seven different regions globally, which can help you get a better assessment of user experience in targeted regions.
You can also get a detailed and in-depth overview of resource usage and monitor metrics like TTFB, First Paint, RUM (real user monitoring) Speed Index, etc. with different graphs and visualizations. Another interesting feature is the page loading video, which can help you pinpoint issues accurately from a user’s perspective. The only downside of this tool is it can be a bit daunting for first-time users, as it’s not easy to identify which parameters are most crucial for tracking a website’s performance.
2. WebPageTest
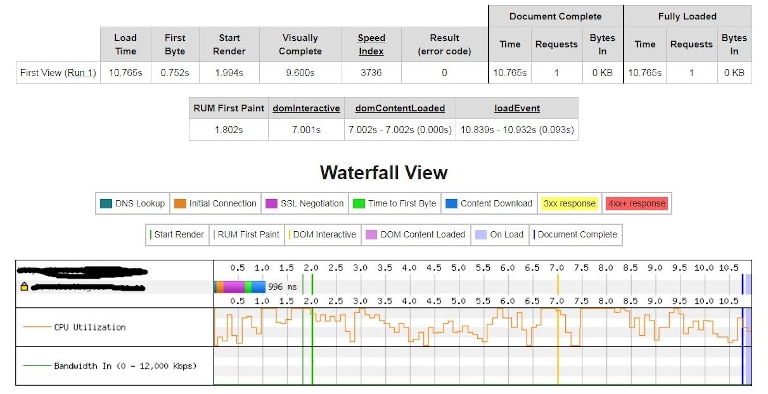
If you want a free tool for measuring webpage performance, you can check out WebPageTest. Though it’s a free tool, it still gives options to select different browsers and server locations to get detailed insights about user experience. The tool takes slightly longer to run tests but gives you enough options to drill down and pinpoint issues affecting your website speed. It also offers waterfall charts to help you monitor the time taken by every request in a visual manner. A simple thumb rule for analyzing waterfall charts is inspecting their width; a wider chart indicates slower loading web page. Further, you can also create custom metrics as per your monitoring requirements. Being open source, it’s one of the most customizable web monitoring tools in the market.
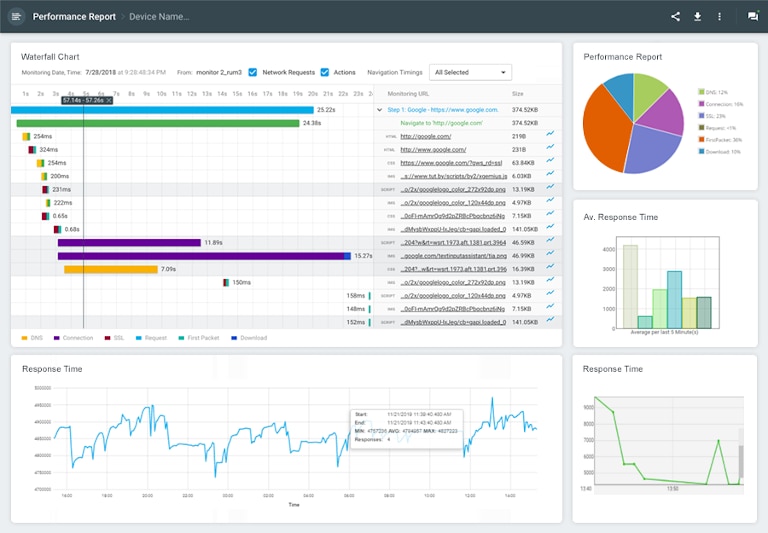
3. SolarWinds Pingdom
SolarWinds® Pingdom® is another capable tool offering a much simpler yet effective and faster assessment of your website. It offers monitoring of website uptime statistics, page speed, transactions, and real users (RUM) with servers present in 100-plus locations around the world. The tool also supports synthetic monitoring. You can run a free website test using the Pingdom Website Speed Test.
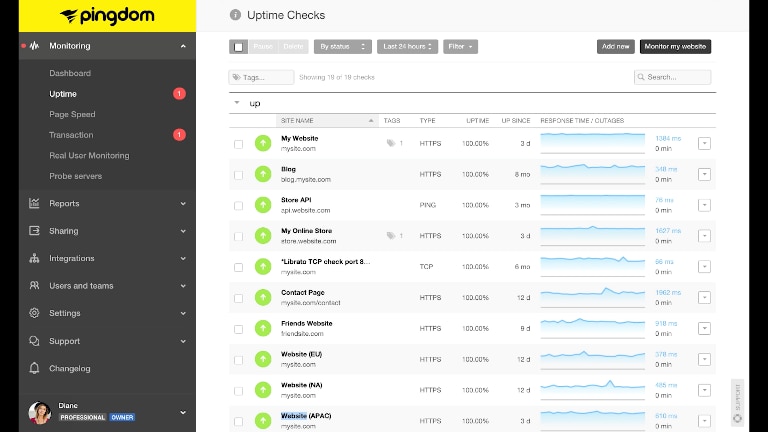
It gives you a quick summary of test results with recommendations for improving page performance. You also get a tabulated summary of response codes, content size by content type/domain, and requests by content type/domain. Further, you can inspect file requests by load time, loading order, wait time, DNS time, status code, and other options. One of the primary advantages of Pingdom is its intuitive user interface, which makes it easier for new users to make the most of the tool. It’s easy to set up email/SMS alerts with Pingdom and it also integrates seamlessly with notification services like Slack and Pagerduty. Further, you can install Pingdom’s mobile app, which connects with the uptime monitoring service to help you track your website’s availability on the go. You can learn more about Pingdom’s features and pricing here or sign up for a 14-day free trial.
4. PageSpeed Insights
PageSpeed Insights by Google can be an effective tool for monitoring your website’s performance. However, it’s mostly preferred by teams focusing on search engine optimization (SEO). As you run a test, it gives a succinct summary of various parameters, with options to drill down on issues of your interest.
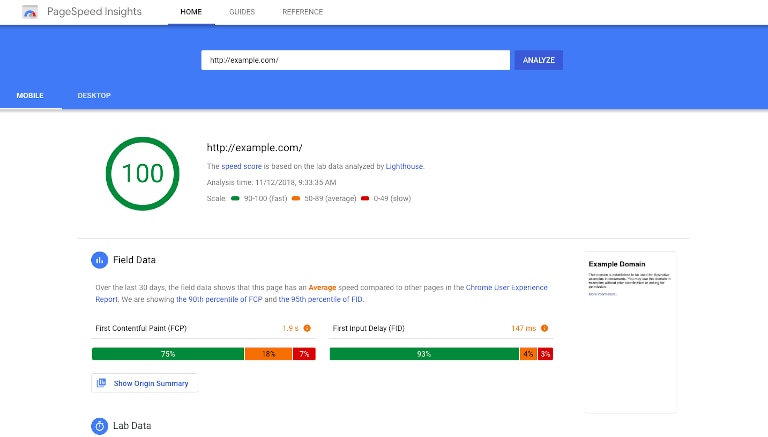
You can inspect several on-page and back-end elements of your web application and how they affect loading speeds and response rates. The tool helps you monitor the grades of various primary components, and also provides recommendations to optimize different elements. The tool can be ideal for tech-savvy marketing teams and even help developers get up to speed with Google’s web guidelines and recommendations.
5. Uptrends

Uptrends is an established player in the web monitoring space. It offers a highly intuitive dashboard to keep track of different load times, errors, metrics, and waterfall charts. You can run tests using multiple browsers from more than 200 locations around the world. The tool also allows you to test website performance on mobile devices. You can simulate slower mobile networks (2G, 3G, etc.) using the bandwidth throttling feature, to test how your website performs in such conditions. However, you’ll have to subscribe to business or enterprise plans to monitor transactions, APIs, and enable multi-browser testing. Real user monitoring is also limited until you subscribe to more expensive plans.
6. Dotcom-Monitor
Dotcom-Monitor offers an exhaustive list of web performance monitoring features including availability testing, transaction monitoring, performance metrics, alerts and also event logs and mail server monitoring. All these features can help you get granular visibility into every user’s web journey and ensure a better experience with continuous optimizations. Like other advanced commercial tools, it also offers waterfall charts and video playbacks to monitor different load times and browsing patterns. The tool also offers a wide range of integrations to help you get the most out of your existing operational setup. A major highlight of the product is its historical trend analysis and reporting feature, which allows you to predict future performance results based on key metrics.
7. Site24x7

Site24x7 is another powerful website performance monitoring solution, which offers all common and extended features such as monitoring of website defacement, SOAP web services, REST APIs, and more. With this solution, you can get a detailed view of website uptime statistics and performance of your web applications using testing servers spread across 90-plus global locations. You can also track key performance metrics with intuitive dashboards and receive timely alerts to respond quickly and troubleshoot issues in real time. While the solution is apt for end-to-end monitoring, the initial setup can be a bit challenging and it takes considerable effort to fine-tune alerts and notifications.
8. Uptime Robot

Uptime Robot is a simple tool to check website status. With the paid version of this tool you can automatically ping your website every minute to check website status. If you get a 200 response code, your website is up. In case there’s any error code, the tool performs several checks and eventually raises an alert. You can receive these alerts via SMS, email, or any other services like Slack, Telegram, and more. Unlike other tools mentioned in this article, it doesn’t offer any recommendation or other advanced options for troubleshooting web performance issues. However, the free version of this tool can be a perfect option for smaller organizations who need a simple tool to track website availability.
Conclusion
As discussed throughout this article, website performance can be impacted by a wide range of factors including numerous components like images, CSS, JavaScript, underlying hardware, and networking issues. Modern web monitoring tools can help you track different metrics and performance indicators to help you stay on top of your website’s performance. Still, finding out which tool can meet your requirements the best can be a challenging task. We recommend trying out a free trial of SolarWinds Pingdom. We found the solution easy to use and it offers all basic and advanced features for web performance monitoring. It’s also a viable option for those organizations wanting to try out a SolarWinds solution for full-stack monitoring of their cloud-native applications deployed in a hybrid environment. The SolarWinds APM Suite consists of tools like Pingdom, AppOptics™, and Loggly®, and helps you track logs, traces, metrics, and users for end-to-end monitoring of your applications.