
The Java programming language is easy to use and often employed by web developers to develop applications. However, monitoring a Java-based application’s performance might become challenging as it’s not a straightforward process. Troubleshooting inefficiencies requires implementing several monitoring techniques to track Java logs, metrics, infrastructure data, and other operational aspects. The following sections list some best practices that may guide you to monitor Java-based applications effectively, along with a list of top Java monitoring tools to help you excel at monitoring Java-based applications.
Topics index:
Top 5 Java monitoring tips to optimize applications
- Get Started With Code Profiling
- Spot Java Log Errors With Transaction Tracing
- Optimize Logging Libraries for Smart Troubleshooting
- Find and Fix Performance Bottlenecks
- Track Exceptions to Increase Efficiency
8 Best tools for powerful Java monitoring
- SolarWinds AppOptics
- SolarWinds Server & Application Monitor
- JProfiler
- Eclipse Memory Analyzer (MAT)
- Stagemonitor
- VisualVM
- JavaMelody
- Sematext Experience


Top Java Monitoring Tips to Optimize Applications
Get Started With Code Profiling
Experts recommend users initiate monitoring of Java-based application with systematic code profiling. This is a direct approach to isolate inefficiencies and regressions in the code. Profiling the Java code helps you identify slow performing areas in the Java virtual machine (JVM) system. To overcome manual code profiling hassles, developers must download profiling software with live code profiling capabilities to promptly detect code errors and pay more attention to troubleshooting.
Spot Java Log Errors With Transaction Tracing
Transaction tracing helps track errors within the Java logs. It’s feasible to use transaction tracing software to trace app transactions. Efficient software helps identify slow transaction areas and quickly traces the transactions back to their origins in the log data. Tracing application transactions is an effective way to get to the root cause of errors in the Java logs.
Optimize Logging Libraries for Smart Troubleshooting
A strong understanding of JVM logging libraries simplifies the monitoring process and accelerates Java performance troubleshooting. Users with knowledge about logging libraries know how to effectively revisit log data for faster troubleshooting. Users can access Java logging libraries manually or via automated log management software to get details regarding SMTP server logs, console logs, and other historical Java logs for effective troubleshooting.
Find and Fix Performance Bottlenecks
It’s imperative to detect and resolve performance bottlenecks early in the process to avoid application slowdowns or malfunctions. You should analyze several JVM performance metrics such as garbage collection, heap usage, and response time to effectively identify and prioritize bottlenecks according to the issue severity. A JVM troubleshooting software automates bottleneck detection and helps to fasten the troubleshooting.
Track Exceptions to Increase Efficiency
In Java, the term “exception” has a unique connotation and is defined as a pre-configured code line that helps identify programming errors. Monitoring exceptions helps fine-tune Java performance. Leverage a JVM troubleshooting software to speed up exception tracking—it aids monitoring by providing corresponding exception metrics and graphical summaries.
Embracing the above Java monitoring best practices can help you notch up your Java application performance. Now, let’s look at some top Java monitoring tools.
Best Tools for Powerful Java Monitoring
It’s critical for users to select the best-fit solutions for their requirements. Let’s deep dive into this list of widely used Java monitoring tools.
SolarWinds AppOptics

SolarWinds® AppOptics™ acts as a Java monitoring tool and helps developers analyze Java-based applications down to the code level. It offers Java application integration for providing detailed and real-time troubleshooting. It lists JVM metrics on the dashboard for effective and continuous monitoring. Nearly all Java-based app management processes, from JMX integration to code profiling, are easily implemented with this tool in a unified way.
SolarWinds Server & Application Monitor
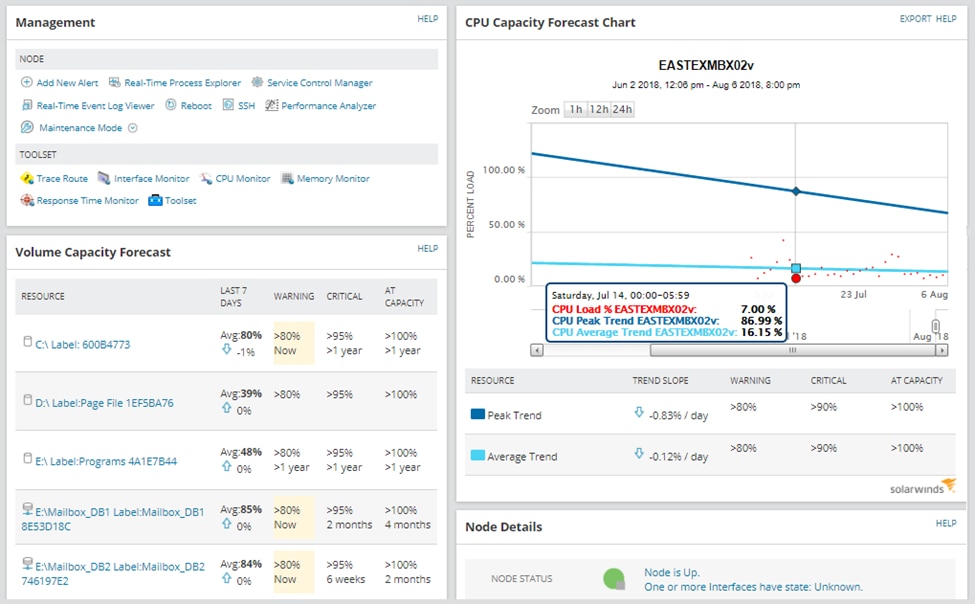
SolarWinds Server & Application Monitor (SAM) is a comprehensive server and application monitoring tool that offers performance monitoring for over 1,200 applications and systems, from Active Directory to Azure. You can start tracking changes typically within minutes thanks to SAM’s 250+ out-out-the-box application monitoring templates. SAM also allows users to create custom templates to monitor custom applications alongside their commercial applications.
SAM offers powerful Java virtual machine (JVM) monitoring tools to help you monitor key performance indicators. You can monitor pool size, memory heap size, transaction response time, garbage collection, application uptime, CPU usage, and more to detect any performance bottlenecks in applications running on Java virtual machines in real-time. With SAM’s help, you can quickly pinpoint and resolve performance issues or stop them before they occur.
SAM can help you quickly discover database and server hardware performance issues that might be behind poor-performing Java applications. For example, you can track performance metrics for MongoDB, MySQL, SQL Server, and Oracle to identify any problems and improve your application’s performance. You can monitor JVMs from different vendors and across different physical or virtual servers with SAM.
SAM consolidates metrics from multiple servers and applications in a centralized view and creates easy-to-understand charts, making monitoring and troubleshooting easy.
SAM only monitors Java commercial applications and servers and isn’t capable of monitoring Java code, but you can integrate SolarWinds AppOptics into your SAM environment as long as you have Orion administrator privileges and a SolarWinds Cloud Token for an active AppOptics organization. SAM is also compatible with the SolarWinds Orion® Platform, a comprehensive and scalable platform that allows for centralized monitoring and can provide deeper context into Java application performance.
SolarWinds offers SAM on a subscription basis, but you can also purchase perpetual licensing. Sign up for a free, fully functional 30-day trial of SAM today.
JProfiler
JProfiler enables users to overcome performance challenges while identifying memory leaks. It also helps users have a better understanding of threading issues. JProfiler helps developers view a set of objects from various angles with the help of a smart UI. This tool also allows developers to solve memory problems.
Eclipse Memory Analyzer (MAT)
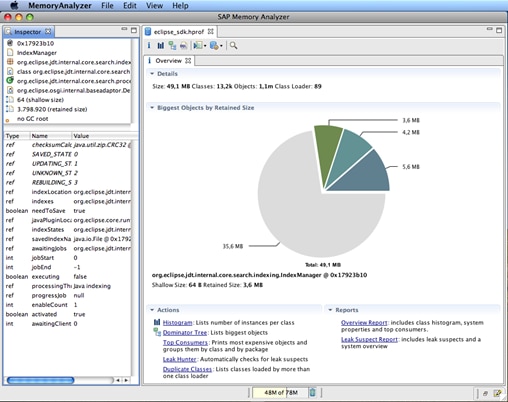
Memory must be monitored continuously in a Java-based system. Java objects are stored in heaps, and when an application runs, the heap’s storage fluctuates in size. The Eclipse Memory Analyzer works as a Java heap analyzer and helps pinpoint memory leaks. It also reduces memory consumption and analyzes productive heap dumps to calculate the retained sizes of objects. It allows users to run a report for extracting leak suspects automatically.
Stagemonitor

Stagemonitor is built for monitoring applications in a distributed system. It’s useful for clustered application stacks and helps developers monitor Java-based applications running on multiple servers. Developers can use Stagemonitor to gain application performance insights in development, testing, and production stages. It provides an overview of real-time and historical data from both the cluster and the developer server and lets users create threshold-based custom alerts for better monitoring. JVM Dashboard from Stagemonitor allows users to access information about CPU and heap utilization, along with garbage collection behavior in real time.
VisualVM
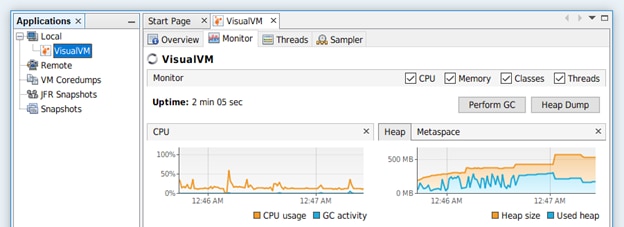
VisualVM is a one-stop Java troubleshooting tool with a great visual interface. It integrates command-line JDK tools and offers complete visibility about Java applications running on a Java Virtual Machine. Java VM includes various tools such as JConsole and jstatt. The graphical representation the tool offers helps you view data of multiple Java applications in a uniform way no matter the environment where they’re running.
JavaMelody

JavaMelody was designed specifically for Java EE applications and lets users measure and calculate the actual operations of applications in the QA and production phases. It’s an open-source tool and integrates with most applications. As it’s free of database and profiling, it’s very lightweight.
Sematext Experience
Sematext Experience makes finding slow-loading pages in your Java-based websites and web applications simple with its full resource waterfall view. You can view detailed load time analysis, inspect fonts, stylesheets, JavaScript files, images, and other resources (as well as their associated load times), and drill down into filterable data by everything from URL to geolocation. Sematext records every page-load event and displays them in charts, offering valuable insight into how much time is spent on the back end and in the browser. You can even configure Sematext to send you real-time performance issue alerts, so you can improve your front-end performance as quickly as possible.
Sematext Experience doesn’t have any overage charges or fixed data buckets and offers unlimited sources and users. Access a free 14-day trial of Sematext Experience today.
Conclusion
The right Java monitoring tool helps users get critical insights, optimize performance, and maximize uptime. The right Java monitoring tool should be cost-effective and scalable to match your business needs. Our choice for Java monitoring is SolarWinds AppOptics, and a full featured 30-day free trial is available. Follow Java monitoring best practices to get a hold of your Java-based application to deliver optimum performance.