
In most organizations, IT teams are often understaffed and overworked, handling multiple bits and pieces of their distributed IT environment. Numerous dashboards and constant alerts are a way of life. However, one of the most crucial components to be managed and monitored is a database server. As an organization’s databases grow in scale and complexity, DBAs, data analysts, and developers find it difficult to maintain them efficiently.
Good database design is directly related to the performance of an application. A poorly designed database can cause SQL queries to run slow and hamper overall performance. For mission-critical applications, delay of a couple of milliseconds in fetching the information can create huge problems. As a result, DB admins need to find ways to optimize the database server. Before they begin, DBAs must have a concrete execution plan in hand to spot the areas in need of attention. To accomplish this, they can use SQL Server Management Studio to generate graphical execution plans.
Let’s look at the top 10 tips for SQL Server performance tuning
- USE THE DATABASE ENGINE TUNING ADVISOR
- ANALYZE WAIT STATISTICS
- FIND THE QUERIES CREATING A PROBLEM
- FINE-TUNE THE QUERIES
- GET A STRONGER CPU FOR ENHANCED PERFORMANCE
- LOOK OUT FOR THE INDEXES
- KEEP LOG AND DATA FILES SEPARATE
- TRY NOT TO OVERLOAD SQL SERVER
- UPDATE DATABASE VERSIONS
- CONSIDER COMMERCIAL SOLUTIONS FOR PERFORMANCE OPTIMIZATION
1. Use the Database Engine Tuning Advisor
An important performance optimization tool for SQL performance tuning is the Database Engine Tuning Advisor. This tool allows admins to evaluate single Transact-SQL statements or a batch of statements to determine where improvements can be made. Based on the result of the analysis, the tool also recommends actions to take.
2. Analyze Wait Statistics
Every time SQL Server slows down, the software related errors should be checked first. There are scenarios when the server stops functioning and wants the assistance of specific resources to complete the function. To keep track of the requirement, it’s important to monitor the wait statistics. This can be done by observing the performance of different threads. To achieve this, the wait statistics of threads are calculated using sys.dm_os_wait_stats. This concept is known as Dynamic Management View (DMV), as it helps discover and diagnose SQL Server performance problems.
3. Find the Queries Creating a Problem
There’s usually a set of queries or stored procedures hindering application performance. DBAs should be able to locate them using SQL Server Dynamic Management View or DMV and fine-tune them for better consistency without implementing any additional software or hardware. The admins must carefully analyze the results of the queries and keep track of the average run time.
4. Fine-Tune the Queries
Fine-tuning a query is an important step for the smooth functioning of the database. The developers must have enough experience and knowledge to write appropriate T-SQL queries and implement indexes, so the SQL optimizer can perform the required task.
A few steps to take under consideration to fine-tune the queries include:
- Identify the operators increasing the query cost
- Try to execute the analytical queries at an off-peak time
5. Get a Stronger CPU for Enhanced Performance
A powerful CPU is always better for fast and efficient execution of queries. If the database underperforms, you should consider upgrading the CPU to a higher class.
6. Look Out for the Indexes
After fine-tuning the queries, DBAs should check how the indexes are used. Indexes can speed up the data retrieval process. Indexes accomplish this by implementing data structures to keep the data organized and make locating the information easier.
The admins should identify unused indexes and remove them immediately to optimize the performance. Indexes use a lot of CPU and I/O capacity. SQL Server also needs to update the indexes whenever we operate on the database. So, to improve the performance, lots of indexes should be used on tables. Clustered and non-clustered indexes should also be implemented where appropriate. At the same time, you should avoid using updated indexes.
7. Keep Log and Data Files Separate
Companies generally skip placing their log and data files onto different physical drives when setting up a database. This seems tedious but is helpful in the long run. Log and data files need to be stored on separate drives as the writing and accessing of log files is sequential, whereas writing and accessing of data files is non-sequential. Storing log and data files separately onto other physical drives can enhance the system’s performance levels.
8. Try Not to Overload SQL Server
DBAs must ensure the production server continuously runs smoothly and serves the customers without any delay. To achieve this, separate databases should be maintained for different environments like production, development, testing, and analytics.
9. Update Database Versions
Database performance largely depends on the currently deployed version of the database server. Installing the latest version of the database server can significantly impact the overall performance of the database. Although few queries may perform better in older versions than in the new one, it’s still better to use the latest version for recent updates.
Along with the above points for optimization, the companies also need to have a proper SQL Server monitoring solution in place to keep the server’s performance intact. An ideal SQL Server monitoring tool will not only generate timely notifications but also provide deep insight into the root cause of issues and suggest solutions to troubleshoot them quickly.
10. Consider Commercial Solutions for Performance Optimization
Many commercial solutions are available in the market for SQL performance optimization. We recommend trying out these solutions as they offer a host of features to help simplify your work by automating routine tasks. We’ve listed a couple of options based on our research.
SolarWinds® Database Performance Analyzer (DPA) is one of the best SQL Server performance monitoring tools to help database administrators manage and monitor the performance and availability of their SQL databases.
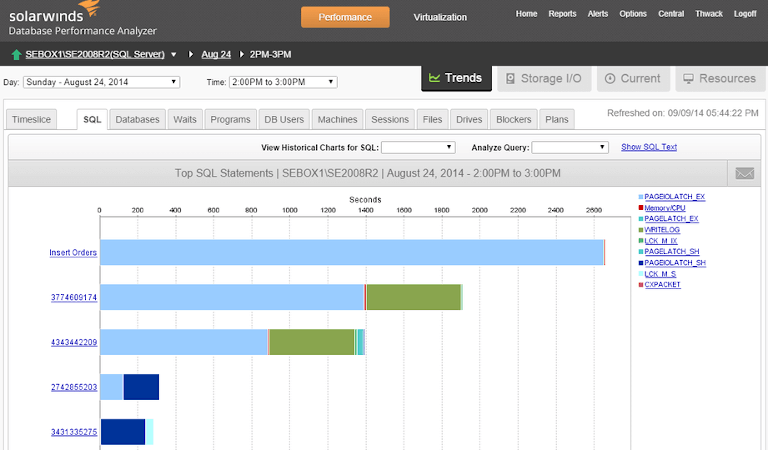
The tool provides a holistic view of the entire database across key dimensions, including SQLs, Applications, Waits, Users, Client Machines, and more. It helps DBAs identify T-SQL queries and indexes needing to be optimized. The tool provides the flexibility to customize the dashboard for better visibility of applications, servers, storage, and infrastructure health. DPA database management solutions can easily be integrated with other SolarWinds tools. It also provides 24/7 monitoring and allows admins to compare the current state of the system with historical data to resolve issues.
Alternatively, you can check out SentryOne, which provides granular visibility into SQL Server performance issues. A dedicated dashboard gives a quick overview of actionable metrics, helping you get to the root cause of problems. The tool helps in identifying problematic SQL queries and bottlenecks. You can also automate responses for certain common situations.