
Today, more and more organizations are adopting DevOps, continuous integration, and continuous delivery (CI/CD) practices to achieve higher agility and efficiency. With these practices, organizations are introducing new features to their applications and releasing more frequently than ever before. Cloud-based infrastructure and platforms have made it easier for organizations to achieve higher scalability and expand their business. However, the rapid growth has made IT environments highly complex; today, most organizations have a mix of traditional and next-gen devices, servers, and monolithic and microservices-based applications deployed over hybrid clouds. As every device in this environment produces logs, administrators can struggle to monitor log tails. In this article, we discuss which tools can help organizations stay on top of their environment with real-time log monitoring.
Live Tail Command
Most IT administrators are familiar with the tail command used in Linux to view the end of text files. The command prints the final 10 lines of a text file and is similar to the ‘head’ command, which prints the first 10 lines. As most logs are in the plain-text format, the command helps monitor the log files. Administrators can increase or decrease the number of lines displayed by using the ‘-n’ argument along with the command. Also, they can rely on the follow mode to update the output as soon as new lines of logs are added to a log file. This tail -f or tail -F functionality is commonly referred to as the live tail. With live tail, administrators can monitor every critical event in their production environments. However, with large log volumes, it’s difficult to monitor every event. Administrators often use ‘grep’ command along with the live tail to capture specific errors (e.g., 4XX, 5XX errors). It’s also possible to control the log volumes with logging levels to reduce noise
Challenges With Real-Time Monitoring
Not long ago, developers and SysAdmins relied heavily on the above-mentioned command-line utilities to troubleshoot issues on local servers or some remote machines. They would often set up ssh connections and monitor multiple log tails on different terminal windows. While IT teams still use live tail utilities on their terminal, modern IT environments require a different approach for monitoring. Enterprises use multiple virtual machines and containerized applications. Since it’s easy to spin up virtual servers, managing the virtual sprawl can become a major challenge. It’s impossible for IT teams to log in to different hosts and systems to monitor the log tail for every log file.
This is where log management tools offer a way forward. Several cloud-based log management tools and Logging as a Service (LaaS) providers can help aggregate logs from multiple sources. The tools provide a unified log stream with live tail, search, filtering, and advanced visualization features to help monitor the distributed environments effortlessly. Listed below are some of the common tools for log monitoring and analysis.
Open-Source Solutions
Many large organizations popular open-source tools like Elasticsearch, Logstash, and Kibana, (commonly known as the Elastic Stack) for log management and analysis. Elasticsearch is the core of this solution and offers a powerful multi-threaded search to provide quick search results, even when searching through a large volume of log data. Logstash is used for log aggregation, and Kibana helps in the visualization of logs. Depending on monitoring needs, organizations may have to add message queues for log persistence. While ELK is a highly capable solution for real-time log monitoring, it can pose challenges during initial configuration. Often, the managerial overheads and costs in managing the open-source solution remain hidden. Organizations may consider managed service providers or ELK-based commercial solutions that help make the most of logs.
Commercial Log Management Tools
Organizations can also try out commercial solutions like Splunk, Sumo Logic, LogDNA, etc., to manage their IT environments and monitor different logs and metrics. These tools offer advanced features for security information and event management and can integrate well with CI/CD practices. It’s possible to live tail logs with these tools; however, they also offer many advanced features for log analysis. For instance, you can visualize log data to understand trends and anomalies. With visualization, it becomes easier for administrators to spot irregular spikes, after which they can drill down to individual logs and associated lines of codes to troubleshoot the issue. These tools may have a higher learning curve and some of them are built to meet the monitoring needs of large organizations.
If you’re looking for simple cloud-based tools to search and analyze logs in real-time, we suggest SolarWinds® Papertrail™ as a viable option.
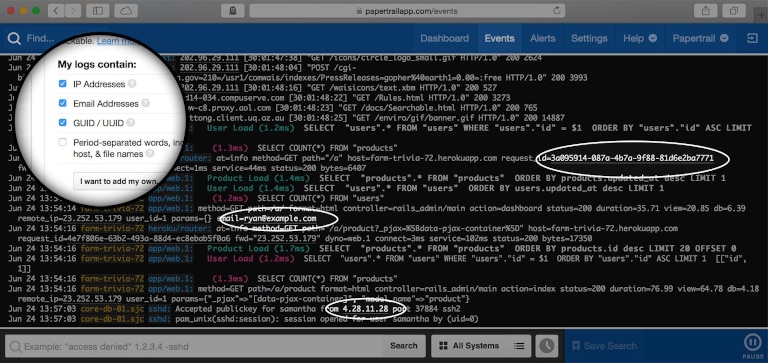
Papertrail is a lightweight tool and collects logs from a wide range of sources. You can use its event viewer to get a live tail of all your logs within its auto-scrolling window. The event viewer simplifies real-time log monitoring, as you can pause the trail of logs at any time, scroll up and down, and skip to a specific time to inspect events of your interest. The log messages have clickable elements (IP addresses, email addresses, GUID / UUID, domains, file names, etc.), which simplify search experience. You can simply click to search log messages by a particular element; there’s no need to write complex queries for the purpose. Further, Papertrail supports Google-like search. You can save critical searches and create alerts to troubleshoot issues proactively. The alerts can be forwarded to any third-party service (Slack, Pagerduty, etc.) or email. Unlike traditional log monitoring tools, Papertrail can search through several days of log data and provide results quickly.
Conclusion
Tailing log files in real-time can help developers detect errors and troubleshoot issues before they cause major damage. Log management tools like Papertrail can significantly enhance troubleshooting speed and experience by providing a simple approach to monitor log files from multiple sources in a single window. SolarWinds Papertrail is easy to set up and allows you to start tailing your logs typically within a few minutes. We recommend a free trial of Papertrail to organizations seeking a simple and powerful log viewer for their distributed environments.