
Logging can be of high importance when it comes to NGINX. Whether you use it as a main web server, a static content server, a reverse proxy, or a load balancer, you need to analyze your logs to understand if your NGINX performs well. There are a few options when it comes to log analyzer tools for NGINX. There are also tools non-specific to NGINX but capable of fulfilling the task. In this article, you’ll learn about a few of them. I’ll cover how they work and how they can help you. We’ll also talk about how to choose a suitable for your needs, and other options.
Different Needs, Different Solutions
There isn’t a one-size-fits-all solutions. Depending on your needs, you may find one tool is better than others in your case. This is totally fine. Below, I’ll describe some of the most popular options with an explanation of when it would be best to use one or another.
Visitors
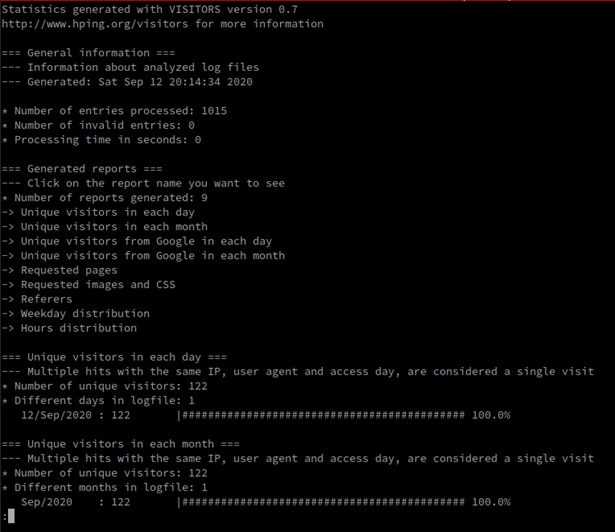
Visitors is a simple open-source project allowing you to quickly create an HTML or text report from your NGINX logs. This is great for when you need to quickly get an overview of crucial information like the number of visitors, their IP addresses, requested pages, etc. By executing visitors –output text /var/log/nginx/access.log | less, you’ll receive this information in an easy-to-read format:
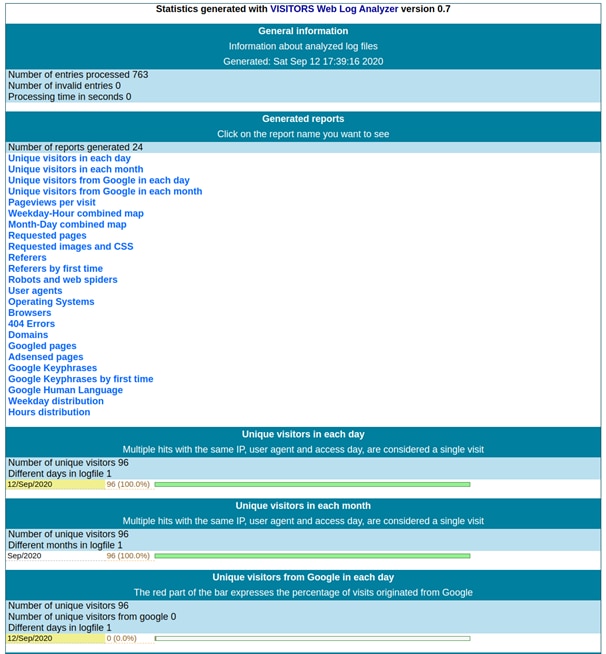
Visitors can process up to 150,000 log entries per second. It can operate in real-time stream mode where statistics are dynamically updated. Instead of interacting with Visitors on the command line, you can also generate HTML files. They can then simply be sent anywhere (via email for example), as they don’t require any extra stylesheets, files, or libraries. For the same reason, however, they’re simplistic—perhaps even too simplistic nowadays:
With Visitors, you’ll receive a report with important information needed to get an overview of your NGINX health. On top of basic report generation from log files, it can also provide you with a traffic graph. It’s definitely one of the unique features of Visitors. The graph shows how users are interacting with the website—something hard to understand from raw logs. In order to view the graph, you’ll need to install the Graphviz package. With Graphviz installed, you can generate the graph data with Visitors:
visitors—prefix http://your_domain.com -V /var/log/nginx/access.log > graph.dotThen use Graphviz to create a PNG file from the graph data:
dot graph.dot -Tpng > graph.png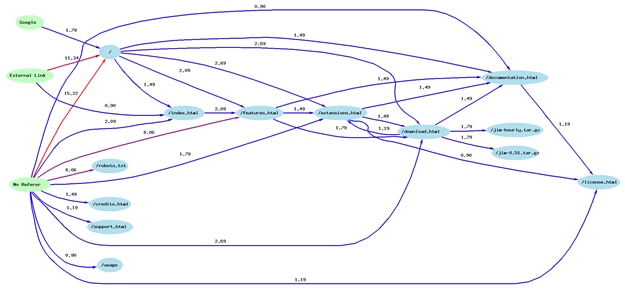
GoAccess
GoAccess is one of the most popular open-source options when it comes to the NGINX log analysis. It has a real-time monitoring option and an interactive terminal viewer mode. It’s fast since it’s written in C, and it can process logs incrementally via on-disk B+Tree database. It was designed with quick log analysis in a terminal in mind (for example, over SSH).
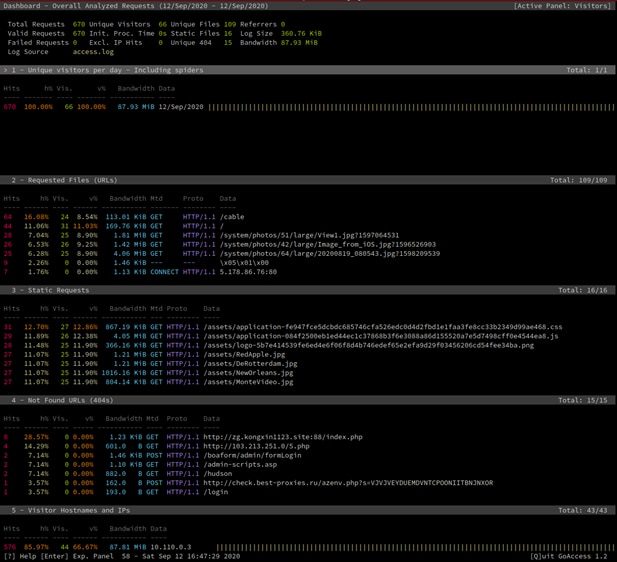
GoAccess is perfect for quick incident management, for example. It generates metrics updated every 200 ms. Therefore, you can get a precise overview of what’s happening with the traffic in real time. This is especially handy in sudden traffic spikes or when something isn’t working properly. It’s also helpful when you need to find out if the issue is in the application, NGINX, or perhaps the network. Instead of tailing the logs and trying to find an issue in tons of streamed messages, you can execute goaccess /var/log/nginx/access.log and get the most important information in an easy-to-read format:
Last but not least, GoAccess also allows you to generate JSON and CSV reports. You can use these as a base for custom automation. They’re also helpful when you want to import JSON-based data into another analytics tool.
ELK Stack
Elasticsearch + Logstash + Kibana, also known as ELK Stack, is a simpler option with more power. This is a different approach to NGINX log analysis than the previous two options. Unlike Visitors and GoAccess, ELK Stack isn’t specific to NGINX (or web servers)—it can aggregate any logs. This gives you some advantages and disadvantages.
As for advantages, ELK Stack is definitely much more powerful and allows you to aggregate logs from other applications and systems. It can act as a centralized log analysis system for your whole infrastructure, not only for NGINX. You may be thinking “Yes, OK, but I only want to know about my NGINX.” But what if your NGINX issues are caused simply by an overloaded server? Or a lack of memory? It’s beneficial to have your system logs aggregated in the same place. In most cases, you’ll also use NGINX as a reverse proxy, which means it’ll serve traffic from another application. For example, you’d probably love to have logs from the actual application analyzed in the same place to make any correlations. Centralizing logs from many sources can definitely bring you some advantages.
Unfortunately, it also brings some disadvantages. First off, setting up ELK Stack isn’t as simple as executing one installation command (which is the case for the previous two tools). It requires much more knowledge and resources to start with. Second, after you’re done with the installation and initial configuration, you can’t just execute one command to get all NGINX logs sorted. You need to create a config file for Logstash and instruct it on how to read NGINX logs. You also need to change the NGINX configuration and instruct it to ship logs to Logstash. So it’s a double-edged sword.
Any Other Options?
These aren’t the only tools capable of analyzing NGINX logs. Any general (not NGINX-specific) log management tool can do this as well. Log management tools also have the advantage of being able to parse your other logs too. They are, unfortunately, difficult to set up and require further configuration and changes for NGINX. You can, however, use a tool like SolarWinds® Papertrail™, which is a managed log analysis solution and has an NGINX logging solution. It solves the problem of complex installation while providing even more features than ELK Stack. You can also read this blog for more reasons to use it. If you want to give it a try and see what it’s capable of, visit Papertrail to get started.
Summary
Logs provide you with the information needed to have an understanding of what your NGINX is up to. Log analysis tools help you to extract this information and present it in a way that will take you a few seconds instead of minutes to answer the questions you may have. I described a few of them, together with an explanation of when it’s best to use which. As you probably already understand, different tools solve different needs. GoAccess is extremely helpful in most cases, but overall, it’s best to have a centralized log management system. If you have resources and enough in-house engineers, you may consider setting up your own ELK cluster. If you want something as powerful as an ELK cluster but at a fraction of the brainpower needed, consider Papertrail.
For further reading, check out this article, which covers in more detail how to properly set up logging in NGINX.
This post was written by Dawid Ziolkowski. David has 10 years of experience as a Network/System Engineer at the beginning, DevOps in between, Cloud Native Engineer recently. He’s worked for an IT outsourcing company, a research institute, telco, a hosting company, and a consultancy company, so he’s gathered a lot of knowledge from different perspectives. Nowadays he’s helping companies move to cloud and/or redesign their infrastructure for a more Cloud Native approach.