The questions of latency vs. bandwidth and throughput vs. latency can often lead to confusion among individuals and businesses, because latency, throughput, and bandwidth share some key similarities. They are also sometimes mistakenly used interchangeably. Despite this, there are distinct differences between these three terms and how they can be used to monitor network performance. In addition to explaining the difference between throughput vs. latency and latency vs. bandwidth, this guide will also provide a definition of each of these terms.
If you’re looking for a tool to help you monitor these metrics and improve your network performance, we recommend SolarWinds® Network Bandwidth Analyzer Pack, Network Performance Monitor, and NetFlow Traffic Analyzer. These SolarWinds solutions are designed to be easy to use, scalable, and can help you implement a comprehensive network performance monitoring strategy.
Skip to network monitoring tools >>>
What Is Throughput?
In the simplest terms, throughput refers to the amount of data able to be transmitted and received during a specific time period. This means the throughput metric measures the average rate at which transmitted messages successfully arrive at the relevant destination. Rather than measuring theoretical delivery of packets, throughput provides a practical measurement of the actual delivery of packets. The average throughput of data on a network gives users insight into the number of packets successfully arriving at the correct destination.

To achieve a high level of performance, packets must be able to reach the correct destination. If too many packets are getting lost during transmission, then network performance is likely to be insufficient. It’s essential for businesses to monitor throughput on their networks, because it helps them gain real-time network performance visibility and improve their understanding of packet delivery rates.
In most cases, the unit of measurement for network throughput metric is bits per second (bps). This is used interchangeably with data packets per second, which also represents throughput. When we measure network throughput, an average is taken and is often considered to be an accurate representation of overall network performance. For example, if your network administrator finds throughput is low, this may indicate a packet loss issue, which often results in low-quality VoIP calls.
What Is Bandwidth?
Bandwidth refers to the amount of data that can be transmitted and received during a specific period of time. For instance, if a network has high bandwidth, this means a higher amount of data can be transmitted and received.
Like throughput, the unit of measurement for bandwidth is bits per second (bps). Bandwidth can also be measured in gigabits per second (Gbps) and megabits per second (Mbps). High bandwidth doesn’t necessarily guarantee optimal network performance. If, for example, the network throughput is being impacted by packet loss, jitter, or latency, your network is likely to experience delays even if you have high bandwidth availability.
Sometimes, bandwidth is confused with speed, but this is a widespread misconception. Bandwidth measures capacity, not speed. This misconception is often perpetuated by internet service providers peddling the idea that high-speed services are facilitated by maximum bandwidth availability. While this may make for a convincing advertisement, high bandwidth availability doesn’t necessarily translate into high speeds. In fact, if your bandwidth is increased, the only difference is a higher amount of data can be transmitted at any given time. Although the ability to send more data might seem to improve network speeds, increasing bandwidth doesn’t increase the speed of packet transmission.
In reality, bandwidth is one of the many factors that contribute to network speed. Speed measures response time in a network, and response time will also be impacted by factors like latency and packet loss rates.
What Is Latency?
Latency measures delay. Delay is simply the time taken for a data packet to reach its destination after being sent. We measure network latency as round trips, although it may sometimes be measured in one-way trips. However, round-trip measurements are more common, because devices usually wait for an acknowledgment from the destination machine to be returned before transmitting the complete set of data. This acknowledgment verifies the connection to the destination device.
If your network is experiencing high levels of latency, this signals poor or slow network performance. In short, the higher your network delay and latency, the longer it will take for a data packet to reach the appropriate destination. The result of latency is often choppy and lagging services. This might manifest as poor-quality VoIP calls, where elements of speech are missing or there is a noticeable lag.
Throughput vs. Latency
Now that you understand the definitions of bandwidth, latency, and throughput, let’s look at the key differences between each and how they relate to each other—starting with throughput vs. latency. Although there are differences between throughput vs. latency, they’re fundamentally interconnected.
The time taken for data packets to be transmitted from source to destination is called latency, as this guide has already explained. Throughput measures the amount of packets processed during a specific time period. The throughput vs. latency relationship should be thought of as two sides of the same coin. Within a network environment, throughput and latency work together to influence network performance.
Latency vs. Bandwidth
The difference between latency vs. bandwidth is another source of confusion, because these concepts go together. As we have already discussed, bandwidth refers to the network’s capacity and the amount of data that can be transmitted during a specific period of time. Latency, on the other hand, is the measure of how long it takes for the data to reach its destination.
There is a close relationship between bandwidth and latency. Bandwidth essentially determines the amount of data that can be transmitted and received, theoretically, at any given time. Latency also plays an important part in how data is transmitted and received, because it measures how quickly the data packets reach the destination. As such, keeping latency to a minimum is an essential part of keeping network speeds high and improving network performance.
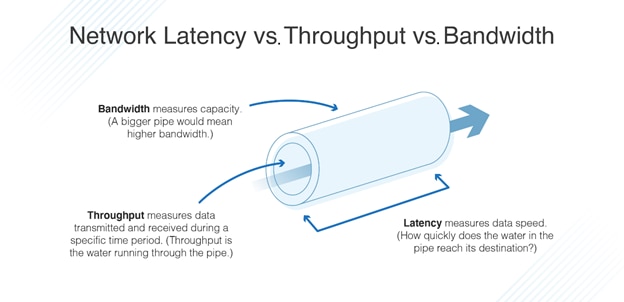
To use a metaphor, bandwidth can be thought of as a pipe. The bigger the pipe, the higher the bandwidth. Latency, on the other hand, measures how long it takes for the pipe’s contents to reach its destination. As such, in the latency vs. bandwidth discussion, it’s important to remember these two concepts are related by cause and effect. The lower your bandwidth, the more time it will take for data packets to reach their destination, which can lead to higher latency. Similarly, the higher bandwidth, the quicker your packets will travel, which can result in lower latency.
Bandwidth vs. Throughput
While throughput and bandwidth may seem similar, there are some notable differences between them. If bandwidth is the pipe, then throughput is the water running through the pipe. The bigger the pipe, the higher the bandwidth, which means a greater amount of water can move through at any given time.
In a network, bandwidth availability determines the number of data packets that can be transmitted and received during a specific time period, while throughput informs you of the number of packets actually sent and received. In other words, bandwidth represents the theoretical measurement of the highest amount of data packets able to be transferred, and throughput represents the actual amount of packets successfully delivered. Because of this, throughput is much more important than bandwidth when it comes to measuring your network’s performance.
Despite throughput being the most important measure of network performance, bandwidth shouldn’t be overlooked. Bandwidth can still impact performance. For example, bandwidth availability can have a notable effect on how quickly webpages load. As such, if you’re intending to leverage web hosting for a web application, bandwidth availability will influence service performance and should be taken into consideration.
How to Measure Latency, Throughput, and Bandwidth
Latency, throughput, and bandwidth can have a notable impact on your network performance, so it’s important to continuously monitor these three metrics. With ongoing insight into network latency, throughput, and bandwidth, your business can take targeted corrective action to improve network performance when necessary. The following three tools can help you monitor these metrics.
SolarWinds Network Bandwidth Analyzer Pack

SolarWinds Network Bandwidth Analyzer Pack combines SolarWinds Network Performance Monitor and NetFlow Traffic Analyzer to give you a complete and versatile network monitoring solution.
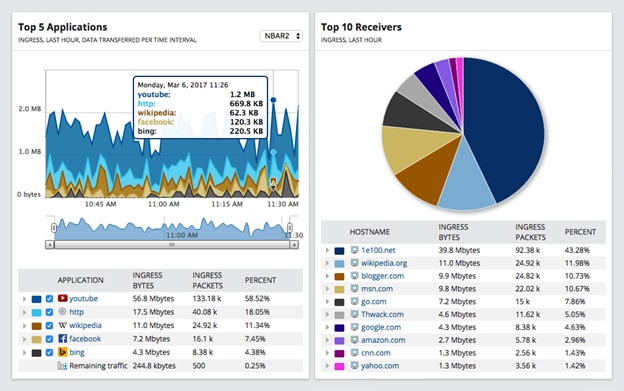
Network Bandwidth Analyzer Pack gives you access to tools designed to help you detect and troubleshoot performance problems on your network. This includes a network traffic monitor, network usage monitor, network interface monitor, and much more. The user interface for this tool is easy to use and makes it simple to identify the culprits of bandwidth hogging.
Network Bandwidth Analyzer Pack allows you to monitor network fault, device performance, and network availability, as well as throughput flow data. This tool also offers network bandwidth control capabilities, by giving you detailed insight into network traffic patterns. Network Bandwidth Analyzer Pack parses data into an easy-to-read format and displays it through the web-based, centralized dashboard.
Network Bandwidth Analyzer Pack is one of the most sophisticated network monitoring tools available on the market and is highly recommended for analyzing key network performance metrics like bandwidth, throughput, and latency. A 30-day free trial is available.
SolarWinds Network Performance Monitor (NPM)

SolarWinds NPM is another powerful network monitoring tool and focuses on enabling businesses to rapidly identify, diagnose, and fix performance issues on your network. This tool’s multi-vendor monitoring features help you increase your service levels, minimize downtime, and make troubleshooting more efficient. With NPM, which provides Azure VNet and Cisco ACI gateway support, you can measure your logical and physical network health.
NPM also features critical path hop-by-hop analysis, with support for cloud, on-premises, and hybrid services. Other key capabilities include cross-stack network data correlation—which makes problem identification faster and more efficient—and out-of-the-box dashboards, reports, and alerts.
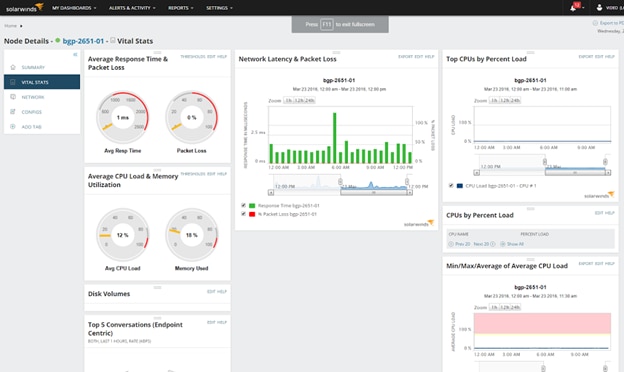
NPM provides an effective and user-friendly way of monitoring all key network performance metrics. It features a dedicated network latency testing utility. You can access a 30-day free trial here.
SolarWinds NetFlow Traffic Analyzer (NTA)

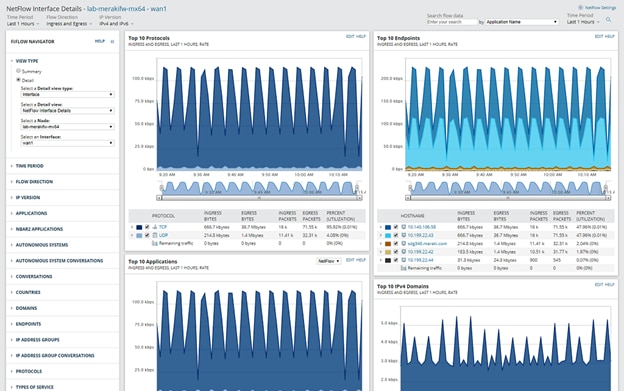
SolarWinds NTA is an add-on for SolarWinds NPM, serving as a multi-vendor flow analysis solution designed to help you minimize downtime. With NTA’s actionable data insights, your team can troubleshoot, diagnose, and optimize bandwidth spend. This tool helps you make informed network investments and solve operational issues with your network infrastructure.
NTA can collect flow data from NetFlow v5 and v9, Huawei NetStream, Juniper sFlow, J-Flow, IPFIX, and more. This tool alerts you if a device stops transmitting flow data or if there are any changes to application traffic.
NTA effectively supplements NPM’s capabilities by helping you identify the cause of high bandwidth. You can fully integrate this solution with additional monitoring modules covering WAN management, config management, IP address management, and much more. A 30-day free trial is available for download. SolarWinds NPM is required to use NTA. No NPM? No problem. You can download free trials of both products in the SolarWinds Network Bandwidth Analyzer Pack.
Solve Network Issues
SolarWinds network monitoring solutions are built to be user friendly, cost effective, and scalable. If you aren’t sure which of these solutions or combination of solutions is right for your company, we recommend taking advantage of the free trials available. Whichever you decide to implement, these tools can give you comprehensive insight into your network latency, throughput, and bandwidth, helping you make informed network performance optimization decisions.


