
Application Performance Monitoring (APM) or Application Performance Management has become a critical function driving business operations and profitability. APM tools allow DevOps teams to keep their mission-critical business applications shipshape. However, the tools and practices for application monitoring have changed significantly with the evolution of application architectures. Unlike monolith applications of the past, which could be deployed over on-premises servers or self-hosted data centers, today most applications are built over microservices architecture and deployed over containers in hybrid cloud environments. Application performance monitoring in such complex stacks requires sophisticated tools and processes; we’ll discuss these tools and their capabilities in this article briefly.
What Are APM Tools?
APM tools refer to a category of application monitoring tools designed to help keep track of application performance and user experience parameters. APM tools provide visibility into the health of a web application by tracking various metrics and traces. While traditionally APM tools offered uptime monitoring, today, these tools offer advanced web app analytics to not only detect but also prevent any potential downtime. Further, you can drill down to specific logs to troubleshoot issues using an APM tool.
What Are the Important Features of an APM Tool?
Infrastructure Monitoring
As every website is supported by servers and various network components, an APM tool should be able to monitor key performance metrics related to the infrastructure. Many APM tools integrate with dedicated server monitoring tools to achieve this capability. By monitoring infrastructure and application metrics together in a unified dashboard, organizations can get a holistic view of their environment to ensure seamless application performance.
Distributed Transaction Tracing
Though primarily associated with the monitoring of microservices-based applications, distributed transaction tracing is a troubleshooting feature capable of bringing visibility into any complex application stack. With this feature, you can track the entire lifecycle of a request across several systems. The application trace requires instrumentation of the application and all components under monitoring. Once enabled, you can trace the path taken by a request and identify the exact components causing delays in the request-execution cycle.
Digital Experience Monitoring
Digital experience monitoring (DEM), further classified into real user monitoring (RUM) and synthetic monitoring, helps in understanding application behavior from the users’ point of view. The purpose of this feature is to track the user experience (UX) of a website over a period. As the name suggests, RUM allows you to track users in the production environment, while synthetic monitoring relies on testing the UX with servers spread across different geographies.
Code-Level Diagnostics
As discussed above, the distributed transaction tracing feature can help in identifying service dependencies and carry out distributed profiling. However, modern websites can contain thousands of lines of code. To debug an application, developers need to identify which line of code is causing error or performance issues. With code-level diagnostics, APM tools allow you to track and identify which of the numerous third-party libraries, APIs, frameworks, or slow-running queries are creating performance bottlenecks.
Top 5 APM Tools
We’ve listed some popular open-source and commercial solutions for application performance monitoring below.
1. SolarWinds AppOptics

SolarWinds AppOptics™ is an advanced APM solution, which integrates easily with SolarWinds ecosystem of network and infrastructure monitoring tools. The solution helps to monitor a wide range of web servers, hosts, applications, containers, VMs, and more with traces and metrics. You can use more than 150 out-of-the-box integrations and plugins to monitor AWS and Azure-based resources, including numerous servers, load balancers, and databases. Further, AppOptics offers auto-instrumentation, which allows you to start monitoring traces and metrics quickly without any manual configurations. Its unified dashboards offer visibility into your distributed environment with all your server, infrastructure, and APM metrics available for correlation. Further, if you identify any anomalies or outliers, you can click a trace and access associated logs using integrations with Papertrail or Loggly®. This helps in quick troubleshooting of application bottlenecks. You learn more about the tool here or get a free trial for 14 days.
2. AppDynamics
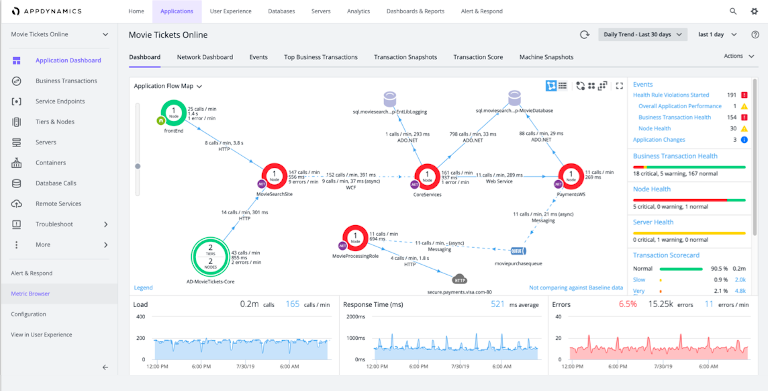
AppDynamics is one of the leading APM solutions by Cisco. It offers both on-premises and SaaS-based options for application monitoring, and organizations can select the deployment as per their requirements. It uses advanced AI-algorithms to help you extract insights from a myriad of infrastructure and APM metrics, traces, and logs. Though the tool is highly intuitive, it might take some time to get used to some of the features. Features such as auto-discovery and auto-instrumentation can make initial set up faster and easier for first-time users. You can create visual dashboards in AppDynamics to visualize critical performance data. It takes a few simple clicks to correlate data from different components of the website and gain actionable intelligence. It’s a highly capable tool for real-time web performance analytics and can be a crucial part of your web operations.
3. Apache SkyWalking
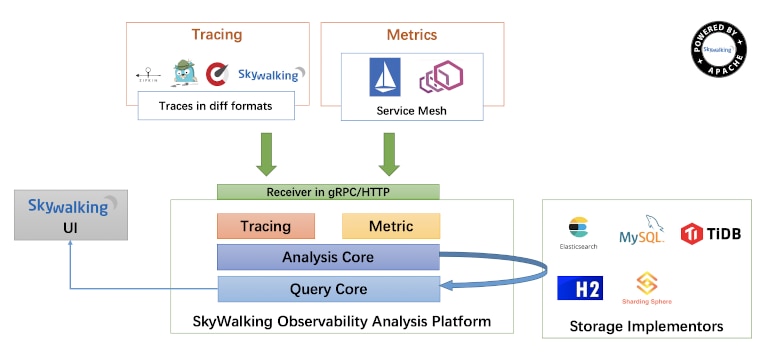
Apache SkyWalking is an open-source APM tool built explicitly for the performance monitoring of cloud-native and microservices-based applications. The tool helps you monitor container-based (Docker, K8s, Mesos) applications. Unlike other APM solutions, which only offer distributed transaction tracing and metrics-based monitoring, the tool also supports service mesh telemetry analysis. The availability of advanced visual dashboards is another striking feature, which makes Apache SkyWalking stand apart from other open-source APM tools.
4. Stagemonitor

If your APM requirements are restricted to the monitoring of Java server applications, you can look into Stagemonitor. It’s an OpenTracing-based APM solution and offers a high level of customization to suit varied monitoring requirements. You can integrate various third-party plugins and configure custom metrics and dashboards to monitor your application environments. Further, it also offers Kibana-based out-of-the-box dashboards for monitoring. It provides you with a clear trace breakdown to highlight the components of the website responsible for performance degradation.
5. Elastic APM
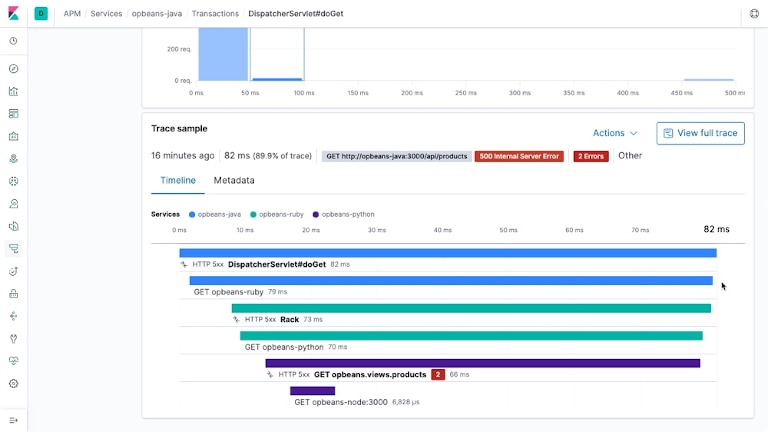
ELK stack (Elasticsearch, Logstash, Kibana) is a popular open-source stack for a wide range of monitoring use cases. With ELK, you can benefit from its high level of flexibility and community support. Elasticsearch’s distributed search nodes offer powerful search, and with code-level diagnostics and distributed tracing, you can get to the root cause of application performance issues faster. It also offers pre-configured visual dashboards, machine learning (ML) based anomaly detection, alerting, and many other advanced features for APM.
Conclusion
We’ve discussed the critical nature of APM in running business operations smoothly, and how APM tools can help in this regard. While evaluating the tools for APM, it’s important to evaluate them with a long-term perspective. While certain tools can meet your immediate monitoring needs, they should also help you stay future-ready. While most of the solutions mentioned in this article have definite strengths, we find SolarWinds AppOptics as an all-around APM solution. It’s simple to implement and offers easy integration with Pingdom and Papertrail, as part of the SolarWinds APM suite. Unlike other tools, AppOptics doesn’t have a steep learning curve. That’s why we recommend a free trial of AppOptics to organizations looking for an advanced APM solution.