
Application development has transformed significantly over the last decade. Organizations have started using a wide range of cloud-based tools and platforms to deliver applications to their customers. Cloud-based infrastructure and platforms provided by vendors like AWS have made it possible for organizations to run highly scalable applications without up-front investments in the infrastructure. However, the primary focus of cloud service providers is to provide higher efficiency and value and not an improved developer experience. Developers often lack a strong understanding of the AWS infrastructure, which can prevent them from making the most of their AWS resources. This is where platforms like Heroku offer better value. Heroku offers application-centric development, ensuring developers don’t have to waste time maintaining and provisioning infrastructure. With Heroku, they can push their code out from a Git repo into a preprovisioned environment using a few simple commands. Still, Heroku is not without its constraints and challenges. Monitoring Heroku apps isn’t simple. In this article, we’ll discuss how you can solve monitoring and troubleshooting challenges in Heroku apps with cloud logging tools.
Logging in Heroku
Logs are crucial for monitoring Heroku apps and infrastructure. With logs, developers can extract data from their apps to debug their applications, monitor their performance, and trace individual requests. They can also help developers keep an audit trail and meet regulatory compliance. In Heroku, the log routing facility is provided by Logplex, which stores up to one week of logs. Developers can use the command line (Heroku CLI commands) to access Heroku logs. However, developers can also use several logging add-ons to automatically export their logs.
The apps running on Heroku create different logs, including build logs, system logs, and API logs. Systems logs contain all the logs generated by the platform and can provide information about critical events such as application crashes, restarts, and so on. The application logs from all the running dynos are printed to stderr or stdout. Additionally, any attached database, third-party service, plug-in, etc. can produce logs.
Heroku also offers router logs, which are present between system logs and application logs. With these logs, you can extract information related to the routing of HTTP requests across the Common Runtime in Heroku. Every web app or service running on Heroku dynos relies on the routing layer for connectivity. Additionally, it’s possible to use the Heroku CLI command to tail router logs. The log messages contain information under various fields, including error codes, description, HTTP request ID, response time, and more.
Though monitoring logs through Logplex and fetching them via command line can be helpful, Heroku also offers a real-time dashboard providing a holistic view of your apps. With this dashboard, developers can quickly monitor the impact of their feature changes, upgrades, and more on resource consumption. It allows them to track critical metrics related to memory usage, platform events, dyno restarts, and so on.
Major Challenges With Heroku Logging
Heroku Logplex is designed to handle single-line log messages efficiently, but issues may arise when it has to deal with multi-line traces. If your application is designed to send stack traces via Logplex, it will treat every new line as a separate message. However, it does little to ensure the messages are in the right order, which means log lines from different components can get mixed. Additionally, the application logging isn’t continued beyond the dynos, making end-to-end monitoring difficult.
Troubleshooting Heroku Apps With Cloud Logging Tools
There are numerous cloud-based log management tools or logging as a service (LaaS) providers capable of offering a seamless approach to Heroku logging. Many of these tools are available as Heroku add-ons, which enable you to route Heroku logs to the respective centralized log management service. Centralized logging solutions allow you to holistically monitor distributed environments where it can be challenging to keep track of logs with different portals and tools. With centralized log viewers, you can easily correlate these logs and effortlessly troubleshoot issues without switching from one system to another. These tools also offer simpler configuration, faster search, and real-time monitoring capabilities, making log analysis effortless for development teams.
How Papertrail Can Help Simplify Heroku App Troubleshooting
SolarWinds® Papertrail™ is a cloud-based log management service designed to simplify the aggregation of Heroku app logs. With this service, you can also aggregate logs from other sources in your distributed IT environment to tail and search them from a web browser, CLI, or API. Papertrail can help you analyze logs and provides alerts to expedite responses. Its event viewer makes log monitoring easier by reformatting the time stamp and source in log messages, improving searchability and reducing noise. The viewer also offers auto-scroll, pause, and many other unique features, allowing developers to inspect events of interest without losing focus. Teams can provision the Papertrail add-on easily from their terminal and open it directly from the terminal itself, or they can use the Heroku dashboard.
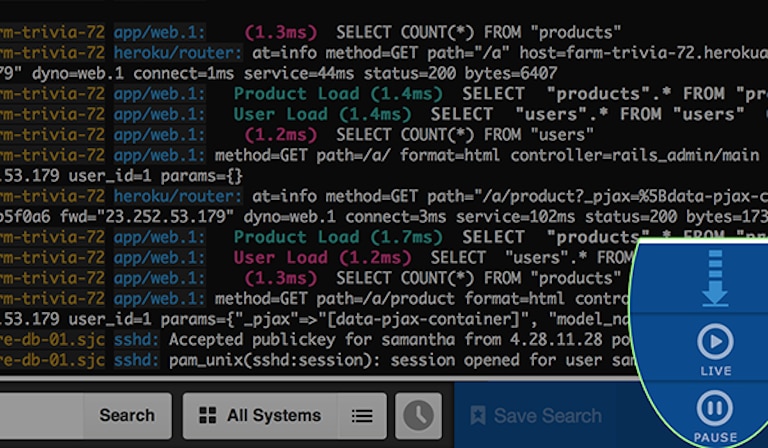
Papertrail is extremely helpful in monitoring and troubleshooting Heroku router logs. You can easily access and filter these logs from other log sources by clicking the “heroku/router” field in the log message. This will list all router logs in the event viewer.
Additionally, Papertrail can help you troubleshoot HTTP 404 errors, which can result from typos in file names or broken app routes. If these errors frequently occur, it can significantly worsen an application’s user experience and should be resolved on a priority basis. With Papertrail, developers can set up an alert to keep track of these errors. These alerts can be sent via email, Slack, PagerDuty, etc. depending on the team’s preference. Similarly, teams can track HTTP 500 errors. With the event viewer in Papertrail, you can click the request ID in log messages and copy and search it to find all logs associated with the error. This helps you find a detailed description of the error from the application code.
Conclusion
Heroku logs provide crucial information about an application’s performance and can help you troubleshoot errors. However, monitoring logs from different components in Heroku can be challenging. Cloud logging tools like Papertrail provide an easy way to aggregate, search, and monitor these logs with a fast and powerful event viewer. You can sign up for a free trial to get started with Papertrail.