
Businesses across all verticals have invested heavily in developing technology solutions to help them achieve higher agility and efficiency. From business functions such as operations, finance, human resource management to customer-facing systems, applications play a crucial role. Ensuring 24/7 availability for all such mission-critical applications requires end-to-end monitoring. The teams monitoring an application in a live environment need ready insights to confirm if it’s responding as per expectations, and all supporting processes and services are running smoothly. If they find any slow-performing transaction, they need to pinpoint which part of the application architecture is responsible. As most businesses are either refactoring or have already moved their monolith applications to cloud-based, microservices architectures, application performance monitoring (APM) becomes even more challenging. At the same time, traditional server performance monitoring solutions offer little help.
With strict Mean Time to Detect (MTTD) and Mean Time to Respond (MTTR) requirements, teams are often overburdened. In the absence of modern APM tools, they can struggle to identify if it’s a bug/error in code, an application server issue, a slow-performing database query, or a network latency related problem affecting their application. In this article, we’ll discuss application performance monitoring in detail and describe some best practices and tools capable of making your job easier.
What Is Application Performance Monitoring?
Application Performance Monitoring (APM) or Application Performance Management refers to the set of practices and tools helping organizations keep track of various performance and User Experience (UX) related indicators of their applications. With APM tools, DevOps teams understand the behavior of their application in normal conditions, detect outliers, perform root-cause analysis, and take remedial actions to resolve technical issues.
As website operations have become more complex over the years, the tools supporting these operations have also gone through significant changes. While traditional on-premises setups for applications could be monitored using server performance monitoring tools, IT-teams have gradually shifted to WPM and APM tools to support their expanding ecosystem. For the uninitiated, the distinction between all these tools might not be apparent.
Difference Between Web Performance Monitoring (WPM) and Application Performance Monitoring (APM)
A WPM solution helps in monitoring business transactions initiated from a browser. It could be a real user responsible for this transaction, or it could be a simulated transaction via servers located across different locations. The end goal of WPM is to measure statistics helping you get insights into the user experience in terms of site performance and usability parameters. On the other hand, APM tools rely on the instrumentation of code and supporting components to capture issues from within an application. However, it’s important to note, modern APM solutions combine both these capabilities for integrated end-to-end monitoring.
Important Features of an APM Solution
Distributed Transaction Tracing
While there are various factors potentially affecting application performance, application code is responsible in most cases. Inefficient algorithms, memory leaks, unhandled exceptions, wrong data structures, etc. can lead an application into performance troubles. Distributed Transaction Tracing helps you resolve such code-level issues in web applications. It’s a troubleshooting feature bringing visibility into the entire lifecycle of a request across several systems. An application trace provides clear visibility of the path taken by a request, which can help you understand which component in the request-execution isn’t performing well.
Code-Level Diagnostics
With traces, you can analyze service dependencies and carry out distributed profiling. However, for debugging an application, you need to pinpoint the exact line of problematic code. Code-level diagnostics helps in detecting whether it’s a third-party library, API, framework, a synchronization issue, slow-running query, or a spin-loop creating application performance bottlenecks.
Infrastructure Monitoring
The underlying infrastructure, including server and several network components, can also affect application performance significantly. APM tools offer infrastructure monitoring in the context of measuring their impact on application performance. These tools integrate server performance monitoring with application monitoring to give a holistic view combining different metrics within visual dashboards.
Digital Experience Monitoring
Digital Experience Monitoring (DEM) helps in understanding application behavior from the users’ point of view. For capturing user experience, most APM tools track changes in bounce rates, load times, page speed, and similar metrics. There are two major types of experience monitoring methods viz. Real User Monitoring (RUM) and Synthetic Monitoring. RUM, as the name suggests, tracks front-end issues in the live environment with real web traffic. On the other hand, the other method relies on synthetically simulating different web transactions from geographically dispersed servers.
What Are the Key Metrics for APM?
While there are numerous metrics for APM, all these metrics can be clubbed into the following two broad categories for better understanding of their scope and relevance:
- Application Time-Series Metrics: Application time-series metrics, such as error rates, requests per minute, average response times, etc. are metrics collected over a long period. By analyzing these metrics, you can understand historical patterns, lingering issues, outliers, and even predict future events. The primary goal of capturing these metrics is to analyze an application’s performance in the wild, and detect if it’s facing any issues; instead of getting to the root cause of such issues.
- Infrastructure Metrics: No matter how many levels of abstraction your application architecture includes, it eventually relies on physical infrastructure. Infrastructure metrics help you gauge CPU and memory consumption, disk I/O, network I/O, and more. With these metrics, you can check if your resources are underutilized or have excess capacity. Further, you can create alerts if resource consumption crosses a predefined threshold.
You can track most metrics at service, transaction, application, and external dependency levels. For instance, Error Rate at the transaction level will refer to the percentage of errors occurring in a particular transaction. If this rate is high for a particular transaction, you might want to take a look at the code and UX-related features to resolve the issue.
Similarly, you can track Count (another metric) of your application instances, to see how many instances are running at a particular time. If you use auto-scaling to meet high-availability, it’s an important metric to track as CPU usage is unlikely to max out even when you encounter increased workloads. Failing to detect an abnormal spike in workloads can inflate your hosting bills significantly in the long run.
Most modern applications rely on microservices architecture, and any slow-performing service can have a cascading effect across multiple applications. Therefore, keeping track of service-level metrics is crucial. You should track Rate, Error, and Duration (RED method) of all such services:
- Rate (per second) – the number of requests served by the service
- Errors (per second) – the number of failed requests
- Duration – the time taken by each request
5 Best Practices for APM
- Aim for Comprehensive Monitoring
- Finalize Key Metrics and Transactions
- Improve Real-Time Awareness
- Integrate APM With CI/CD Process
- Leverage APM Insights for Business
1. Aim for Comprehensive Monitoring
As discussed, application monitoring isn’t restricted to the application layer. While code quality is crucial, you also need to keep track of several physical components and networking parameters supporting your application. Moreover, with hybrid cloud environments, you might also need cloud monitoring features. That’s why you should integrate server and infrastructure monitoring along with Azure/AWS monitoring and database performance monitoring capabilities to stay on top of your applications. APM solutions like SolarWinds® APM Suite provide you with such capabilities. SolarWinds is known for its wide range of IT monitoring and management tools which are popular among enterprises and mid-size organizations. Its APM Suite offers full observability into distributed systems with metrics, logs, and traces, using tools like Loggly®, Pingdom®, and AppOptics™.
2. Finalize Key Metrics and Transactions
While most APM tools offer out-of-the-box metrics, you may also define custom metrics depending on your application and infrastructure monitoring requirements and business objectives. You should identify key metrics from across your distributed environment to get a holistic view and minimize information overload. Similarly, not all transactions in an application hold equal importance. You need to identify critical transactions depending on your business.
3. Improve Real-Time Awareness
While batch processing of bulk data to gauge historical trends and perform predictive analysis, you’ll also need access to real-time actionable intelligence to reduce the performance impact of any unforeseen event. For monitoring real-time application issues, you should have easy visibility in real-time performance and resource utilization data. Visual dashboards with an integrated view of infrastructure and application metrics can help you correlate and analyze data easily. With charts and graphs, you can easily spot spikes and anomalies in your data. Further, you should configure threshold-based alerts for a proactive response.
4. Integrate APM With CI/CD (Continuous Integration and Continuous Delivery) Process
Today organizations want higher agility with frequent release of application features. As ensuring stability and reliability is a crucial requirement, shift-left testing approaches such as TDD (Test-Driven Development) have gone mainstream. To add another layer of reliability and improve test coverage, you should integrate your APM tool with the CI/CD pipeline. The integration will help you test and troubleshoot application performance issues before you move your application to the production environment. It’ll also reduce potential costs and impact caused by any failure in the production environment.
5. Leverage APM Insights for Business
Usually, only DevOps teams leverage APM with the primary goal of keeping their applications shipshape. However, APM can break the silos between IT and business by providing a common language for all teams. Business decision-makers can use custom metrics to measure the impact of infrastructure and application performance on their business and make data-driven decisions.
Top 10 Open Source APM Tools
There are several open-source solutions for application performance monitoring. However, most of the APM monitoring tools have strengths in one area but may lack holistic monitoring capabilities. For instance, there are application-metrics-based tools, which can track the number of requests, errors, slow URLs, etc. but will lack code level profiling. To find answers to why issues are arising, you’ll have to look elsewhere. Similarly, there are network-based APM tools, which measure the impact of network traffic on your application performance. However, these solutions may lack distributed tracing features, which are crucial for complex, full-stack monitoring in hybrid environments. Further, some of these solutions offer monitoring limited to certain languages and servers. Nonetheless, you can explore our list of top APM tools to meet your specific requirements:
1. Apache SkyWalking
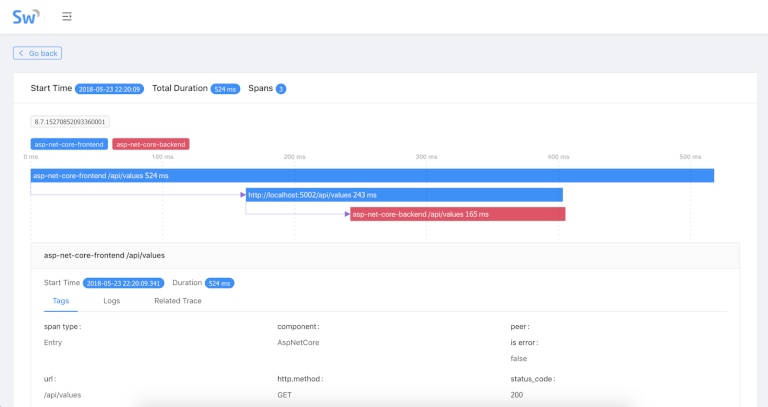
Apache SkyWalking is an open-source APM monitor designed specifically for cloud-native, microservices-based architectures. It supports the monitoring of container-based (Docker, K8s, Mesos) applications. In addition to distributed tracing and APM metrics-based monitoring, Apache SkyWalking also offers service mesh telemetry analysis. You can also create visual dashboards to monitor your application performance and health.
2. Zabbix
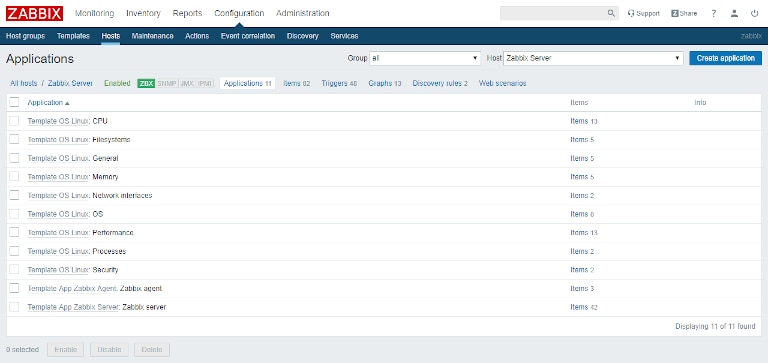
Zabbix is an open-source solution, including a comprehensive range of tools for the monitoring of applications, infrastructure, services, cloud resources, and more. Depending on your requirements, you can configure the solution to auto-discover servers and network components, and monitor key metrics related to network utilization, load times, and disk space, etc. You can use various XML-based monitoring templates for the initial configuration.
3. Stagemonitor
Stagemonitor is an OpenTracing-based APM solution for Java server applications. It’s a highly customizable solution, which allows you to integrate third-party plugins, define custom metrics, and build custom dashboards. The solution also offers pre-built dashboards using Kibana. You can trace requests with a clear breakdown of load times, server speed, and other crucial performance metrics. Stagemonitor can also help in monitoring database performance.
4. PinPoint
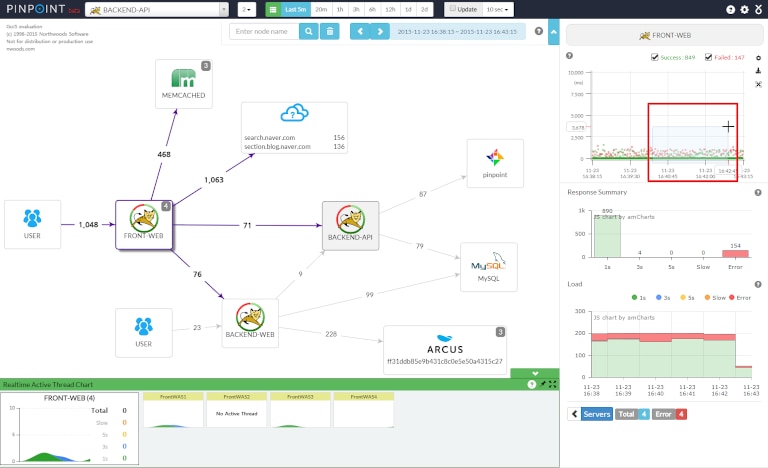
If you want to monitor the performance of your Java/PHP based applications in large-scale distributed environments, you can explore Pinpoint. The open-source tool supports distributed transaction tracing, code-level diagnostics, real-time visibility, and many other useful features. You can also monitor application topology to understand how different components are connected. It’s a lightweight tool, which can be installed easily and offers a high level of customization.
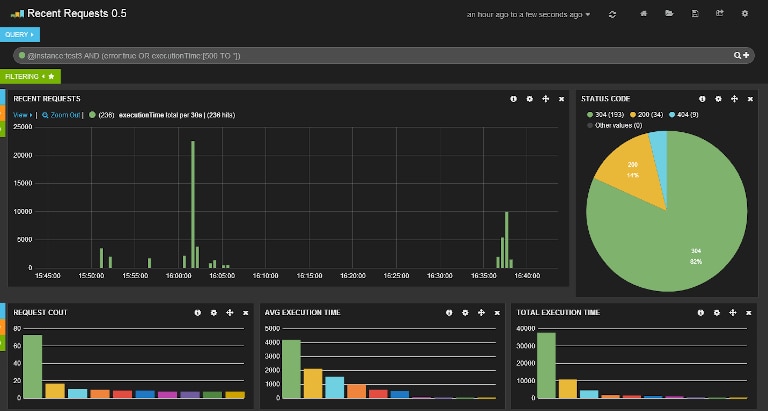
5. Graphite
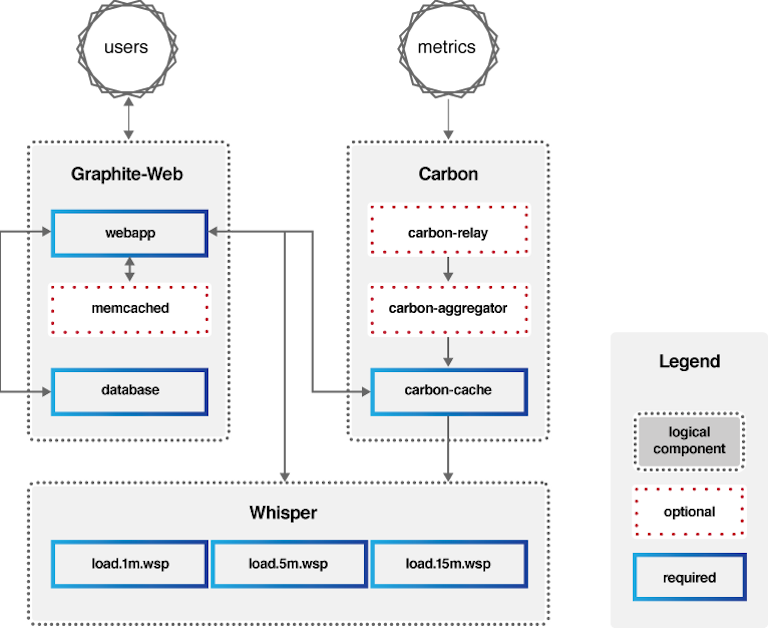
Graphite is a tried and tested open-source tool for monitoring websites, applications, servers, and services. The tool stores time-series metrics and creates visualizations for a better understanding of the data. Graphite’s architecture is simple, consisting of three primary components for collection, storage, and visualization of time-series data. You can use Graphite’s web platform to monitor raw images or extract information in the form of CSV, XML, and JSON formats. The tool can be integrated with other custom visualization tools and dashboards easily.
6. Prometheus

Prometheus is another popular tool for monitoring application performance with time-series metrics. The tool integrates with Grafana for visualization and offers in-memory and local disk-based storage of data. It’s an ideal tool for monitoring highly dynamic, container-based environments. Prometheus performs service discovery or polls different services to collect pull metrics. This approach doesn’t require any agent installation; however, it also makes its configuration challenging.
7. Riemann

Riemann is an open-source tool for monitoring distributed systems. It’s a simple and powerful tool for monitoring large, dynamic infrastructure, and can help you get to the source of application errors and bottlenecks quickly. Essentially an event stream processor, Riemann aggregates events from your applications and servers. With this tool, you can track exceptions, latency distribution, top processes, resource consumption (CPU, RAM, etc.), and more. You can aggregate all statistics and forward them to Graphite for further processing and visualization.
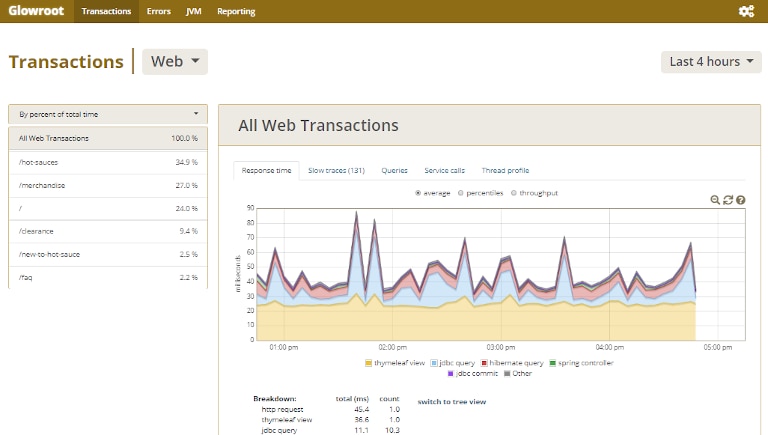
8. GlowRoot
9. MoSKito
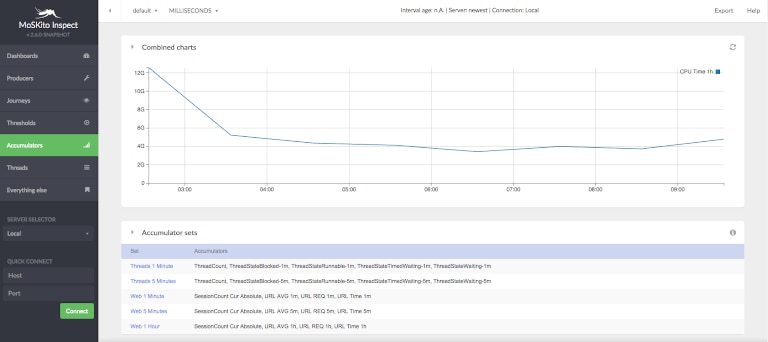
MoSKito is a suite of Java tools for monitoring your applications. It offers centralized storage of performance data from on-premises and multi-node web applications. It collects performance metrics to track threads, memory utilization, service calls, query performance, loading times, and more. The tool also offers threshold-based alerts, web-based dashboards, and even a mobile app to monitor your applications. It’s an effective tool for monitoring Java applications built over microservices architecture.
10. Elastic APM
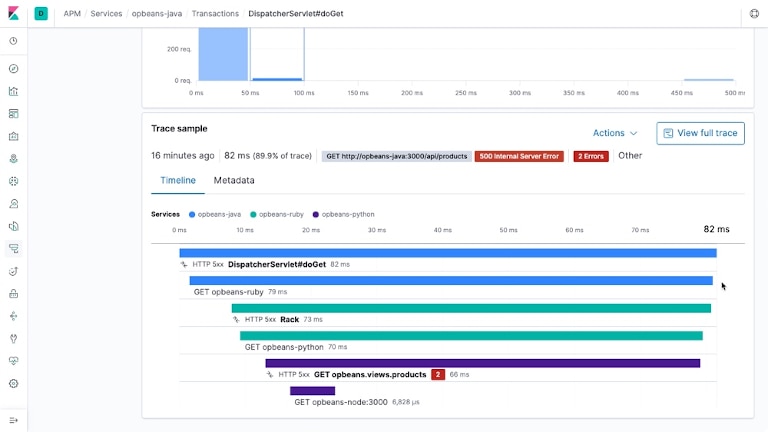
Organizations using ELK stack (Elasticsearch, Logstash, Kibana, Beats) would find it easier to graduate to Elastic APM, which extends its capabilities to accommodate APM use cases. The solution enjoys strong community support and offers comprehensive coverage of APM features. It offers powerful search and code-level diagnostics, distributed tracing of transactions, pre-configured visual dashboards, machine learning-based anomaly detection, alerting, and more.
Why Should You Consider Commercial APM Solutions?
A lot of teams want to leverage open-source APM solutions due to their flexibility. It gives them a chance to integrate different tools and create a solution for their specific needs. However, here are some reasons commercial APM tools are a better choice:
- Comprehensive Features: Many times, teams lack the awareness or willingness to go beyond their conventional monitoring approaches. The tunnel vision restricts them from taking full advantage of their resources. Commercial APM solutions are built with enterprise focus and can help any organization scale up and make use of modern application architectures, effortlessly. With commercial solutions, you get many out-of-the-box features fine-tuned to common monitoring use cases. Further, many of these solutions offer flexible pricing to suit varied APM needs.
- Security and Compliance: Open-source tools require significant time and effort in configuration, maintenance, and updates. However, ensuring these tools meet your security and compliance mandates can be a bigger challenge. With commercial APM solutions, you have lesser things to worry about. Even in case a vulnerability is exposed, the vendor is most likely to release hotfixes and patches, and offer dedicated support to handle the crisis.
- Dedicated Support: Installing and configuring open-source APM solutions might not include any direct cost; however, it does take time and effort. You might run into configuration issues with integrations or while fine-tuning disparate components. You’ll have to rely on your own expertise or refer to endless pages of product documentation, online guides, and community support to resolve such issues. Commercial APM tools are usually easy to install, offer a high level of automation, and also offer dedicated support to solve your unique configuration challenges.
Which Is The Best APM Tool?
If you want granular visibility into your distributed application stack with a tool offering higher ease of implementation, powerful features, and a lower TCO (Total Cost of Ownership), we recommend the SaaS-based APM tool SolarWinds AppOptics. We’ll discuss how AppOptics can make APM simpler for your team.
AppOptics offers distributed transaction tracing capability, allowing you to track issues at service level. This enables you to get to the root cause of issues faster, even if your application architecture is complex. With unified dashboards for monitoring application and infrastructure metrics, you get seamless visibility into your ecosystem consisting of several servers, hosts, containers, and serverless components. Unlike other APM tools, which offer basic server performance monitoring, AppOptics offers a comprehensive view of your resource utilization and performance. You can view CPU, disk space, memory consumption, response times, error rates, time-series data for various processes, and more to stay on top of your infrastructure.

AppOptics also offers AWS monitoring and Azure Monitoring features. You can monitor a wide range of AWS and Azure services, including popular databases, languages, and networking components like load balances, Content Delivery Network (CDN), and more. The tool offers more than 150 plugins and integrations, which help you extend your monitoring capabilities and enhance troubleshooting experience. You can also track important business performance indicators with custom metrics to make the most of your application.
For proactive response against availability and performance issues, you can configure threshold-based alerts. These alerts can be received via any popular notification services such as Slack, PagerDuty, or emails. The tool also allows you to monitor all thresholds from a single dashboard. Getting started with SolarWinds AppOptics is easy. You can sign up for a fully functional free trial for 14 days to evaluate its features and then choose a plan as per your organization’s requirement.
Conclusion
APM plays a crucial role in the health and performance monitoring of modern applications. APM tools covering traces, metrics, and logs—the three pillars of observability—offer better control and visibility into microservices-based applications running within hybrid cloud environments. While APM can provide multiple benefits to organizations of all sizes, choosing an APM solution is often a challenge. As we discussed above, SaaS-based solutions like AppOptics can help you monitor your application performance effortlessly. Features such as auto instrumentation, pre-populated dashboards, smart visualizations (e.g., heatmaps, waterfall charts, etc.), an API to collect custom metrics, and single-click access to logs from their hosts and traces expedite and streamline troubleshooting. Moreover, unlike other tools, AppOptics doesn’t have a steep learning curve. Get started with your 14-day free trial now.