
Your website is at the forefront of your business, and a well-performing website can boost the overall user experience. Over time, however, websites have become more complex. It has become critical to test the performance of websites in real time to identify glitches early on and fix them before it’s too late. Manually doing this can be daunting, and this is where a performance monitoring tool can help.
Most web performance monitoring tools are classified into a) synthetic monitoring and b) real user monitoring (RUM). While synthetic monitoring offers an artificial lab-like environment for testing, real user monitoring gives real-time insights into how users are behaving on the website. RUM ensures continuous data collection and shows the actual performance of real users with the utmost precision.
What Is RUM?
Real user monitoring refers to monitoring the actual user interactions on your website. The primary goal of RUM is to highlight the performance bottlenecks faced by the users in real time so the technical team can fix issues and improve the end-user experience. In general, a RUM tool collects data continuously and gives a wealth of insights such as geographic traffic analysis, page response time, load time, a detailed performance breakdown of various elements on a webpage, performance of third-party scripts and resources, navigation paths, root cause analysis, and HTTP errors, among others.
This article explores some of the best RUM tools you can deploy to track and analyze the performance of your websites and web applications.
SolarWinds Pingdom
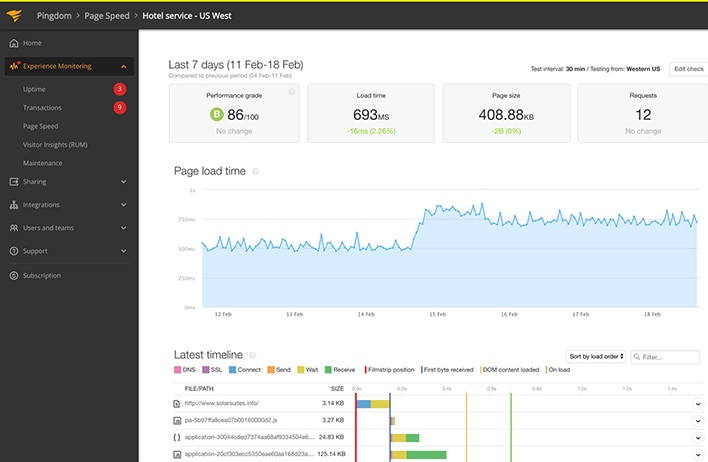
SolarWinds® Pingdom® is a widely known RUM solution popular among professionals for its website speed test tool. Pingdom offers scalable monitoring with features focusing on identifying problems in the live environment, and it offers numerous metrics to help you identify and resolve issues. Key features of Pingdom include the following:
- Live geographic mapping
- End-user monitoring, which visualizes browsers, devices, and platforms used and provides advance filtering to help you identify bottlenecks
- Page load performance, which allows you to set performance levels you consider satisfactory and sends alerts on abnormalities
- User behavior metrics, such as bounce rates, active sessions, top viewed pages, top browsers, and top platforms
- Customizable and shareable web performance reports
Pingdom offers a 14-day free trial, and the pricing starts at US$10 per month.
New Relic Browser

New Relic Browser is another capable RUM solution popular among webmasters. It offers RUM features such as the following:
- Page load performance, which includes advanced metrics to help you improve user experience on dynamic pages, such as single-page app route changes, session traces, browser traces, and geographic reporting
- Browser performance, which gathers and visualizes browser-specific metrics such as page views received per browser type, load time, and browser versions used
- AJAX-specific metrics such as request status codes, calls by page view, and data transfer per request
- JavaScript error tracking
New Relic Browser provides a 14-day free trial, and the pricing starts at US$149 per month.
Akamai mPulse

Akamai mPulse uses a JavaScript framework called Boomerang to measure page load performance. It collects and analyzes real user data in real time to provide actionable insights. With the help of advanced predictive analytics, the tool performs what-if analysis to correlate performance metrics gathered from real user data with business outcomes. Aside from this, the tool provides RUM features designed to do the following:
- Identify problematic page resources
- Track and analyze third-party resource performance
- Support frameworks such as Angular, React, and Backbone.js
- Report perceived performance metrics such as webpage visual readiness and time to interact
Akamai mPulse also integrates with Slack and PagerDuty to send alerts and notifications.
Sematext Experience
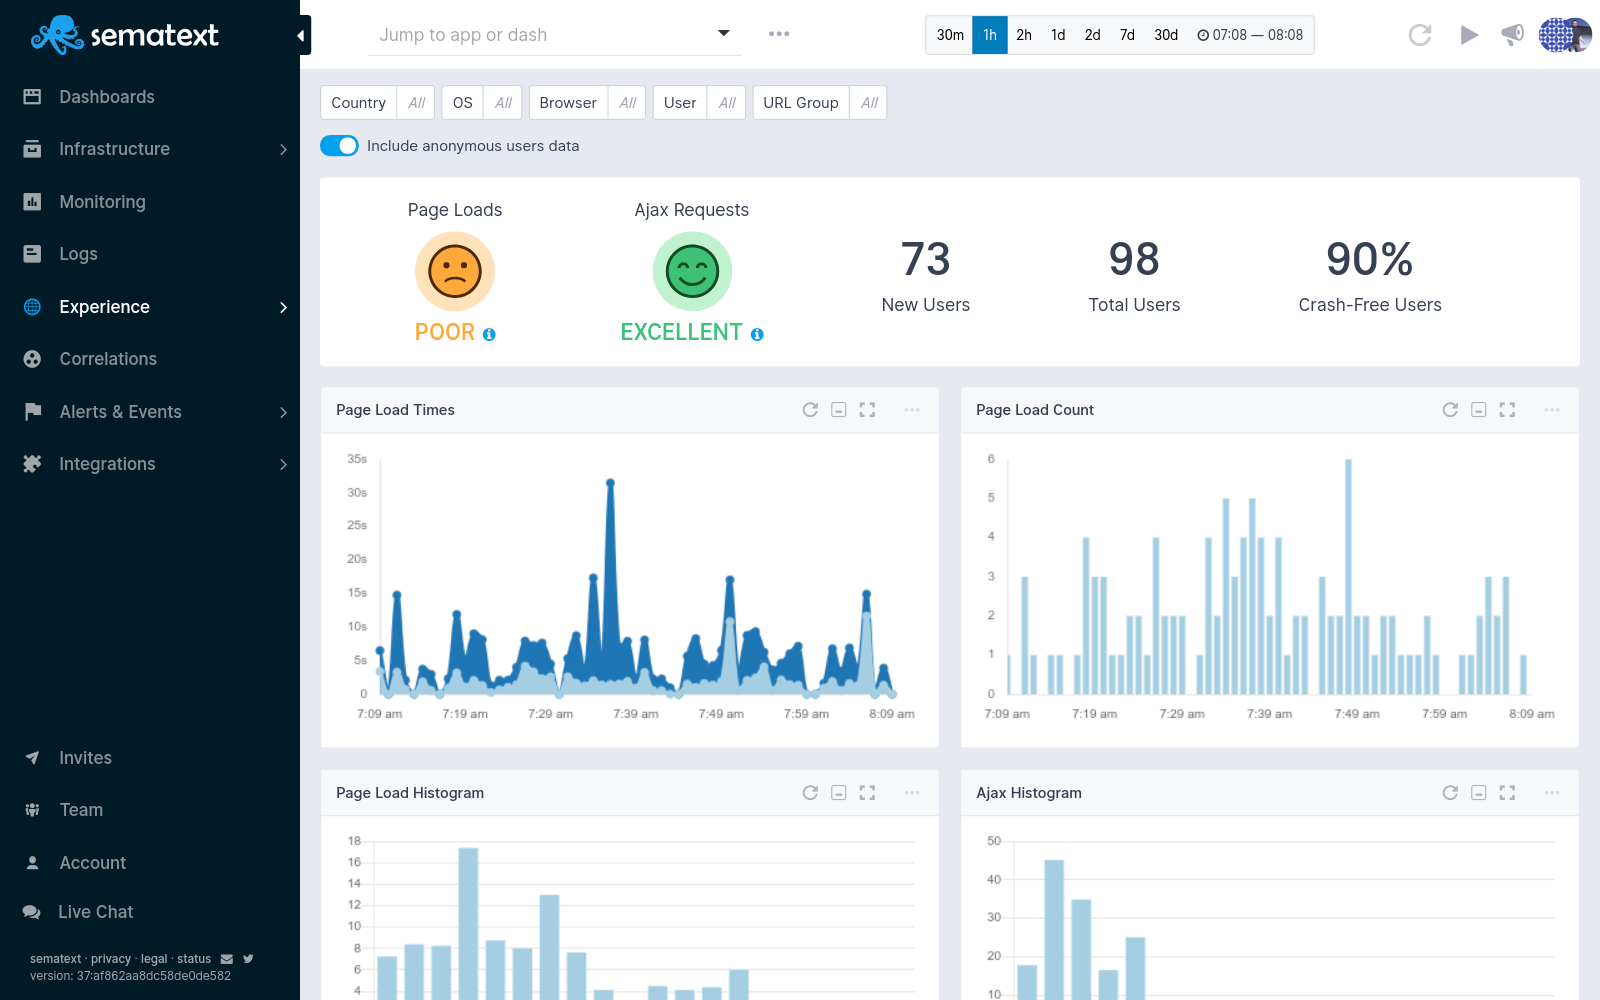
Sematext Experience helps you track HTTP requests, page load times, and UI interactions, and it sends automatic alerts in real time when something impacts the user experience. Additionally, you can set up alerts for monitoring page load time and Apdex score. The tool maps business journeys (which trace real user journeys) to help you understand why real users are facing performance issues. Moreover, it supports single-page applications and frameworks such as React, Vue.js, and Angular. Sematext Experience offers a 30-day free trial; its basic plan is available for free, and the standard plan starts at US$19 per month.
Uptrends RUM

Uptrends RUM not only visualizes page speed times experienced by real users across the country but state or province-wise across the U.S., Canada, and Australia. It provides page load time metrics such as render duration, DOM duration, and page ready time. Additionally, Uptrends RUM compares page views against performance and helps you point out problematic webpages. In addition to its RUM solution, Uptrends offers a synthetic monitoring solution. Uptrends RUM offers a 30-day free trial, and the pricing starts at US$12.02 per month.
Conclusion
The RUM tools discussed here are straightforward to use. For deployment, they require embedding a lightweight JavaScript snippet on each webpage or application you want to monitor. Of all the RUM tools mentioned, SolarWinds Pingdom is most suitable for businesses of all sizes. In addition to RUM, Pingdom also offers synthetic monitoring over a single pane of glass. Though all these RUM tools offer similar features on the surface, the way they handle and retain data, their depth and breadth of functionality, their efficacy, and their integration with synthetic monitoring differ. As all these solutions come with short, free trials, you can test and evaluate whether a tool or solution satisfies your expectations. Having real user monitoring and synthetic monitoring from the same vendor can help correlate metrics better and augment your web performance monitoring strategy.