
Remote Dictionary Server (Redis) is a widely used NoSQL database systems. It’s an open-source in-memory data store known for its high processing speed and performance. It allows quick information delivery and supports several data structures, including strings, lists, hashes, sets, sorted sets, bitmaps, streams, and more. Redis is multi-faceted and supports an array of use cases across industries, including real-time analytics, caching, session management, media streaming, and messaging, among others. In-memory data storage eliminates the need to access data from the disk and thereby eliminates seek-time delays.
Redis databases have an edge over other databases due to flexible data structures and data persistence. However, Redis performance monitoring remains critical, as the database directly impacts application performance. It’s imperative to assess whether the required processes are running as expected, queries are getting executed effectively, and bottlenecks are being identified proactively. To ensure a high level of performance, you should employ an efficient Redis monitoring tool that provides a holistic view of the Redis database and allows tracking Redis performance metrics.
Let’s look at key Redis monitoring tools to help streamline Redis database management and monitoring processes to improve performance and boost efficiency.
SolarWinds AppOptics
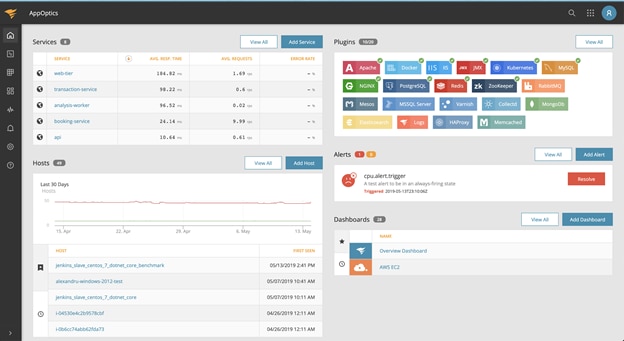
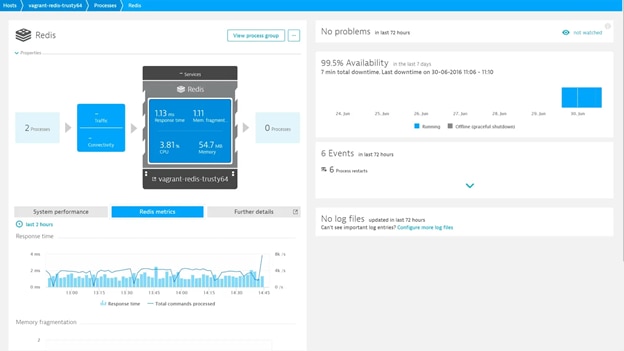
Integrating SolarWinds® AppOptics™ with Redis is an effective way to monitor the Redis database for identifying and troubleshooting the root of performance issues. The AppOptics integration with Redis allows monitoring key Redis performance metrics from a single place. The central AppOptics dashboard provides clear insights across relevant metrics, including uptime metrics, memory metrics, and other Redis internal metrics. Redis monitoring with AppOptics provides insight into the client metrics such as the number of clients connected to a Redis server, the number of attempted clients connections, and the number of clients rejected from the connection. AppOptics also allows users to create custom tags for different categories of Redis performance metrics for better management and quick monitoring.
OpsDash

OpsDash is quick to set up. Its pre-configured dashboards give a holistic view and an instant insight into key performance metrics to assess the health of Redis instances. A quick look at the dashboard provides a clear picture of memory usage, in-memory items, number of operations performed per second, cache hit rate, and other relevant performance areas. It also allows tracking custom metrics and lets the users set critical upper limits for metrics to proactively identify potential bottlenecks.
Dynatrace
Dynatrace provides visibility into individual database statements by allowing users to monitor and analyze Redis databases across all platforms. It lets users track critical Redis performance metrics. Dynatrace offers process-level visibility by tracking network metrics to help users keep track of sudden performance issues. Smart data visualization helps you understand how applications use database resources quickly. Furthermore, detailed metrics help ensure quick root cause analysis to find out which commands affect the database performance the most.
ManageEngine Applications Manager (Redis Monitor)
Applications Manager’s Redis monitor provides critical information about database memory, network traffic, and overall system infrastructure. It allows users to track memory specific metrics such as memory usage, memory fragmentation ratio, and cache hit ratio, among others. Network parameters, including the number of connected and blocked clients, number of concurrent connections, rejected connections, and other connection stats are also easily trackable. Applications Manager’s Redis performance monitoring tool also provides a fault management system to effectively identify the root cause of performance issues and detect anomalies for proactive troubleshooting. It also supports aggregation and visualization of key metrics with the help of extensive and in-depth reports for better performance monitoring and analysis.
SolarWinds Database Performance Monitor (DPM)

SolarWinds DPM is a cloud-based Redis database manager designed to monitor every query and metric on the Redis system. It offers both real-time and historical analysis to detect and resolve performance issues. DPM is designed to drill down from a global viewpoint to a single query on a single server promptly and allows cross-correlations among relevant metrics to get to the root cause of performance issues. Powered by sophisticated big data analytics techniques, such as regression analysis and queuing theory, SolarWinds DPM provides deep insight into Redis metrics and facilitates smart alerting to raise the alarm about potential performance issues before they become a substantial roadblock. SolarWinds DPM automatically discovers the corresponding system requirements to get started.
Conclusion
Redis is a powerful database system used by performance-intensive applications, since it supports sub-millisecond response times. Redis databases support mission-critical applications for many businesses across industries, so the need to proactively monitor and fine-tune the database performance is all the more important to take full advantage of its potential. Redis returns an array of metrics for each command, and tracking these metrics helps ensure the system’s health. We recommend integrating Redis metrics with a dynamic Redis monitoring tool such as SolarWinds AppOptics to get a complete view of your Redis database. AppOptics helps you monitor and analyze a comprehensive set of relevant metrics while quickly performing root cause analysis for performance-related issues to accelerate troubleshooting. Get hands-on experience with a full-featured 30-day free trial now and gain deeper visibility into the health and performance of your Redis database server.