
Updated: 9/26/2022 1:29 PM
Businesses need systems to monitor IT infrastructure to ensure the launch and subsequent operation of their network systems and services. However, monitoring various parts of your IT infrastructure can be a real headache if you don’t choose the right solution.
Regardless of the size of the infrastructure you manage, be it small or enterprise-wide, you can’t do without reliable monitoring tools. Even if you’re just the owner of a personal site, you still need round-the-clock monitoring of your resource availability.
Typically, these systems will keep an eye on your servers and other devices, so you can focus on tasks requiring attention. And if something goes wrong, like operating parameters exceeding the normal range, the system will warn you in a timely fashion.
Today we’re taking a look at five of the best solutions for infrastructure health monitoring. And we’ll start by discussing the need.
The Need
Systems today are more complex than they were ten years ago, and they have many new components. Likewise, more processes are running on a typical computer than ever before. Each of these processes consumes a portion of its host’s system resources. And when all resources are depleted, things start to go wrong. To ensure smooth operation, you need to continually check your equipment’s operating parameters, so you can respond proactively.
It’s not uncommon for the system administrator to be responsible for the operation of dozens if not hundreds of devices, making them nearly impossible to view. Another problem is most of the server’s operating parameters aren’t available and you need a tool to access them.
Mainframe computers of yesteryear had all sorts of sensors and lights on their control panels to alert administrators if there were abnormal conditions. Some early PCs and networking equipment had remnants of these technologies. I remember a home computer with an LED that flashed every time an interrupt was exceeded, but these are long gone.
This is why system monitoring tools have become a necessity. They allow administrators to spend their time on more productive and rewarding tasks while the tool monitors the system and alerts the administrator when something is wrong, usually before it becomes a real problem. This gives the administrator sufficient time to react and fix the problem.
The Best Software for Infrastructure Health Monitoring

There are many software products, both commercial and free (open source), to help you monitor your IT infrastructure. Given the large number on the market, finding the best one in your price range isn’t easy.
Let’s take a look at the various tools we recommend, so you can determine which is right for you.
1. SolarWinds® Server & Application Monitor (SAM)
For IT system administrators tasked with IT infrastructure monitoring across many devices and applications, SolarWinds Server & Application Monitor can provide support for continuously monitoring and tracking data using more than 1,200 applications, system, and infrastructure monitoring templates and over 1,000 community-created templates to choose from, which can allows admins to more easily extend monitoring to custom or home-grown applications and leverage existing scripts to build new monitors. In addition to the wide range of templates, SAM is designed to automatically discover the relationships between applications and servers based on active application communication and can collect network connection statistics, such as packet loss and latency.
SAM is built to offer superior IT infrastructure monitoring to networks of any size. It can allow administrators to detect, alert, and report changes with hardware inventory, registry entries, binary and text files, software inventory, IIS configuration files, and script outputs. And beyond these capabilities, SAM can also automatically records data, making it easier to establish baselines to detect problems better as they arise. Once those baselines are established, the built-in AppInsight™ monitoring templates are designed to deliver deep visibility to help you identify complex performance issues in Microsoft Exchange, IIS, and SQL Server. From there, IT administrators can set up customized alerts to inform the minute SAM detects irregularities to address problems as soon as they arise and minimize downtime.
With SAM’s simple, agentless integration, IT professionals can generally expect to have the monitoring tool up and running within an hour. And for unified IT infrastructure monitoring, SAM is built to seamlessly integrate with other products on the SolarWinds Orion® Platform, including Network Performance Monitor, Virtualization Manager, Storage Resource Monitor, and Web Performance Monitor. We found the licensing to be affordable and straightforward since pricing is based on the number of devices a network plans to monitor. Start with a 30-day free trial.
2. AppOptics

The number one on our list and the best solution for infrastructure health monitoring is AppOptics.
SolarWinds® AppOptics™ is a new cloud-based subscription solution. Out of the box, AppOptics features more than 150 plugins and integrations, including ones for Amazon Web Services (AWS) and Microsoft Azure. Furthermore, it allows you to track metrics and analytics for databases, web servers, hosts, containers, load balancers, and more.
The company offers two levels of service.
The less expensive plan covers infrastructure monitoring but not application management. This plan covers server and network monitoring, AWS CloudWatch integration, and historical data storage.
The higher-priced plan adds application performance monitoring and application delivery tracking. The application management aspect covers both traditionally hosted applications and distributed systems, which can deliver applications through sites or from the cloud. The system’s tracking capabilities show you the resources communications pass through on the way from the server to the endpoint. This will allow you to detect bottlenecks in the network path and move or add resources to optimize delivery times. The dashboard can display applications, servers, and infrastructure metrics on the same screen. This will allow you to see if the underlying services are the cause of the application performance problems. Dashboard facilities include analytical tools allowing you to combine metrics and set ratios and thresholds for your triggers and custom assessments.
The data analyzer consists of a query language enabling ad hoc queries, so you can quickly explore the data emerging from the monitor. Graphical features on the dashboard give you the ability to overlay time change data series, so you can compare your applications’ performance over time.
AppOptics includes several other features you can discover on their site and even offers a free fourteen-day trial, so you can try it out for yourself.
3. ManageEngine OpManager
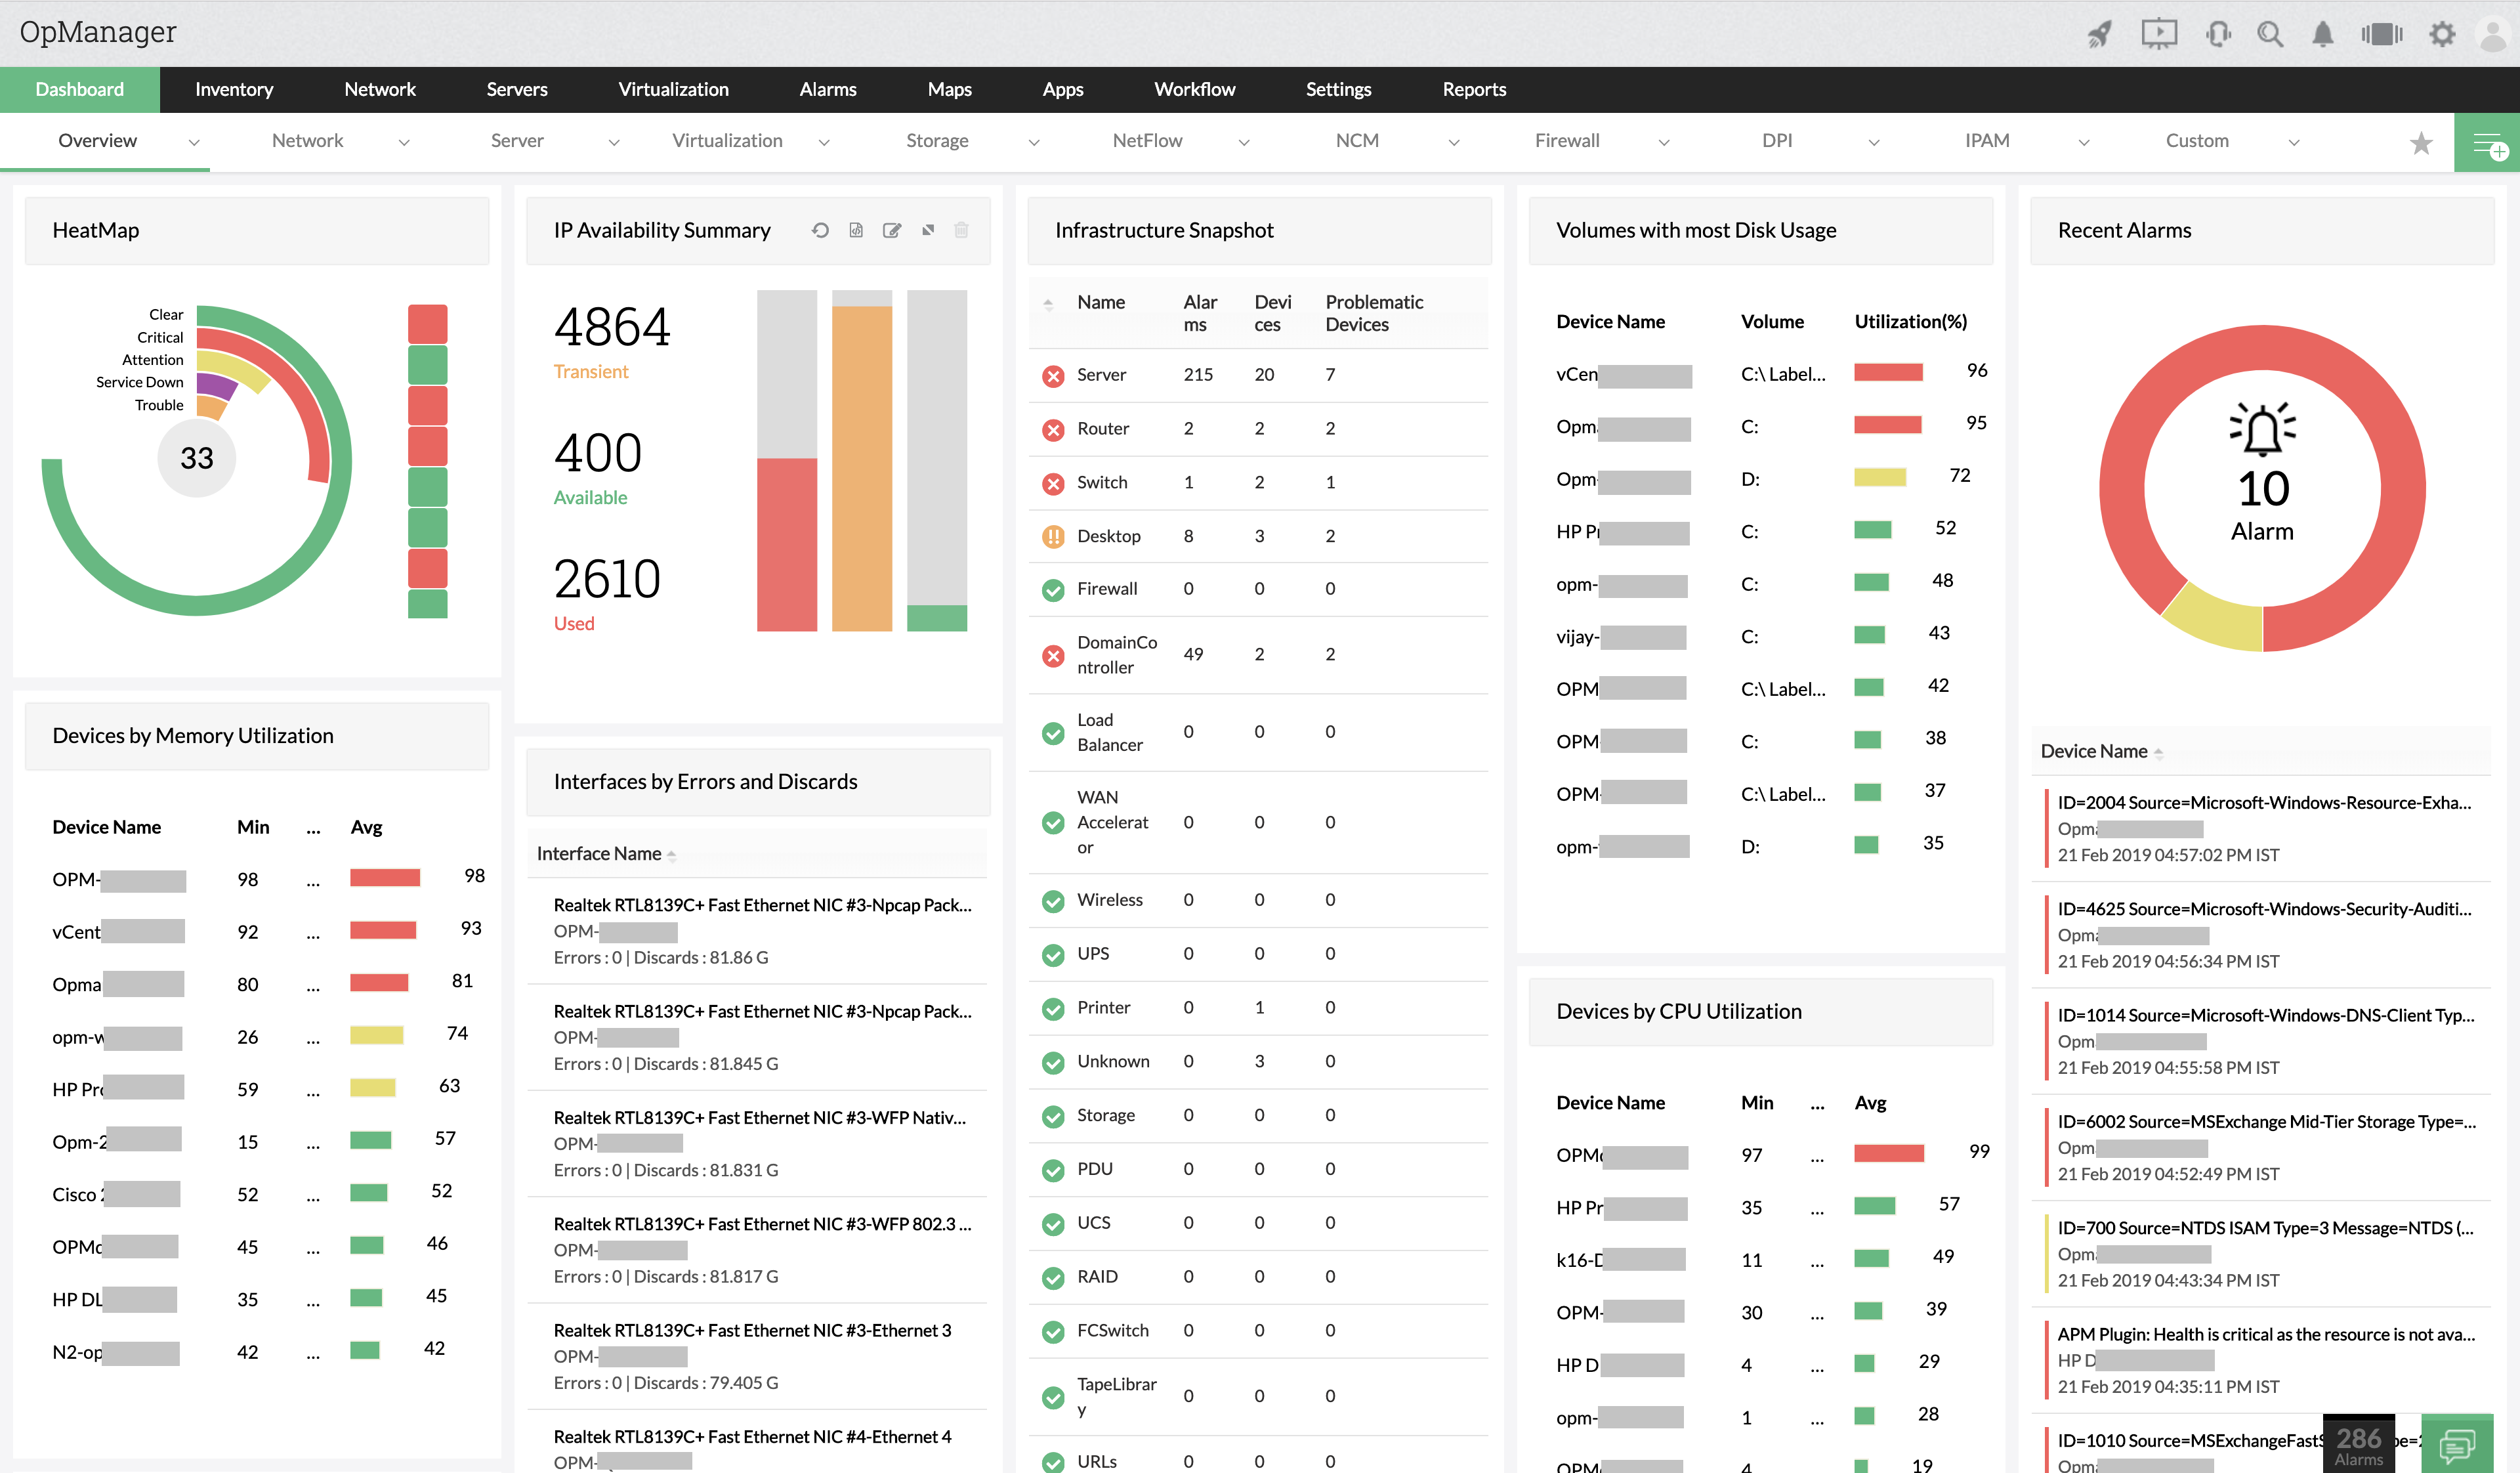
This is another all-in-one package designed to monitor your physical (infrastructure) vital signs and network equipment and alert you whenever something is out of range.
ManageEngine claims its OpManager can be installed in less than two minutes. It’ll then detect your devices and start monitoring without requiring complicated setup steps. The package has an intuitive user interface where you can easily find the information you need. Moreover, it has excellent premade reports and custom ones.
ManageEngine OpManager is available for up to thousands of devices, starting at just over $700 for twenty-five devices. For large organizations, there’s an enterprise version capable of scaling to ten thousand. Its price starts at less than $20,000 for five hundred devices. The cost of both editions varies depending on the number of monitored devices. Both offer a free thirty-day trial.
4. Nagios XI

Nagios XI, the commercial version of Nagios, can be thought of as Nagios on steroids.
It has a richer feature set, easier installation and customization, and a more polished feel. Nagios XI is a dedicated enterprise-grade server and networking software. It uses the same underlying engine as its open-source sibling but adds a powerful GUI.
Nagios XI offers a comprehensive monitoring solution for applications, services, operating systems, network protocols, system metrics, and network infrastructure. Nagios XI is available in Standard and Enterprise editions. If you want to try the product, there’s a free version available, but it’s limited to monitoring seven devices.
5. Icinga
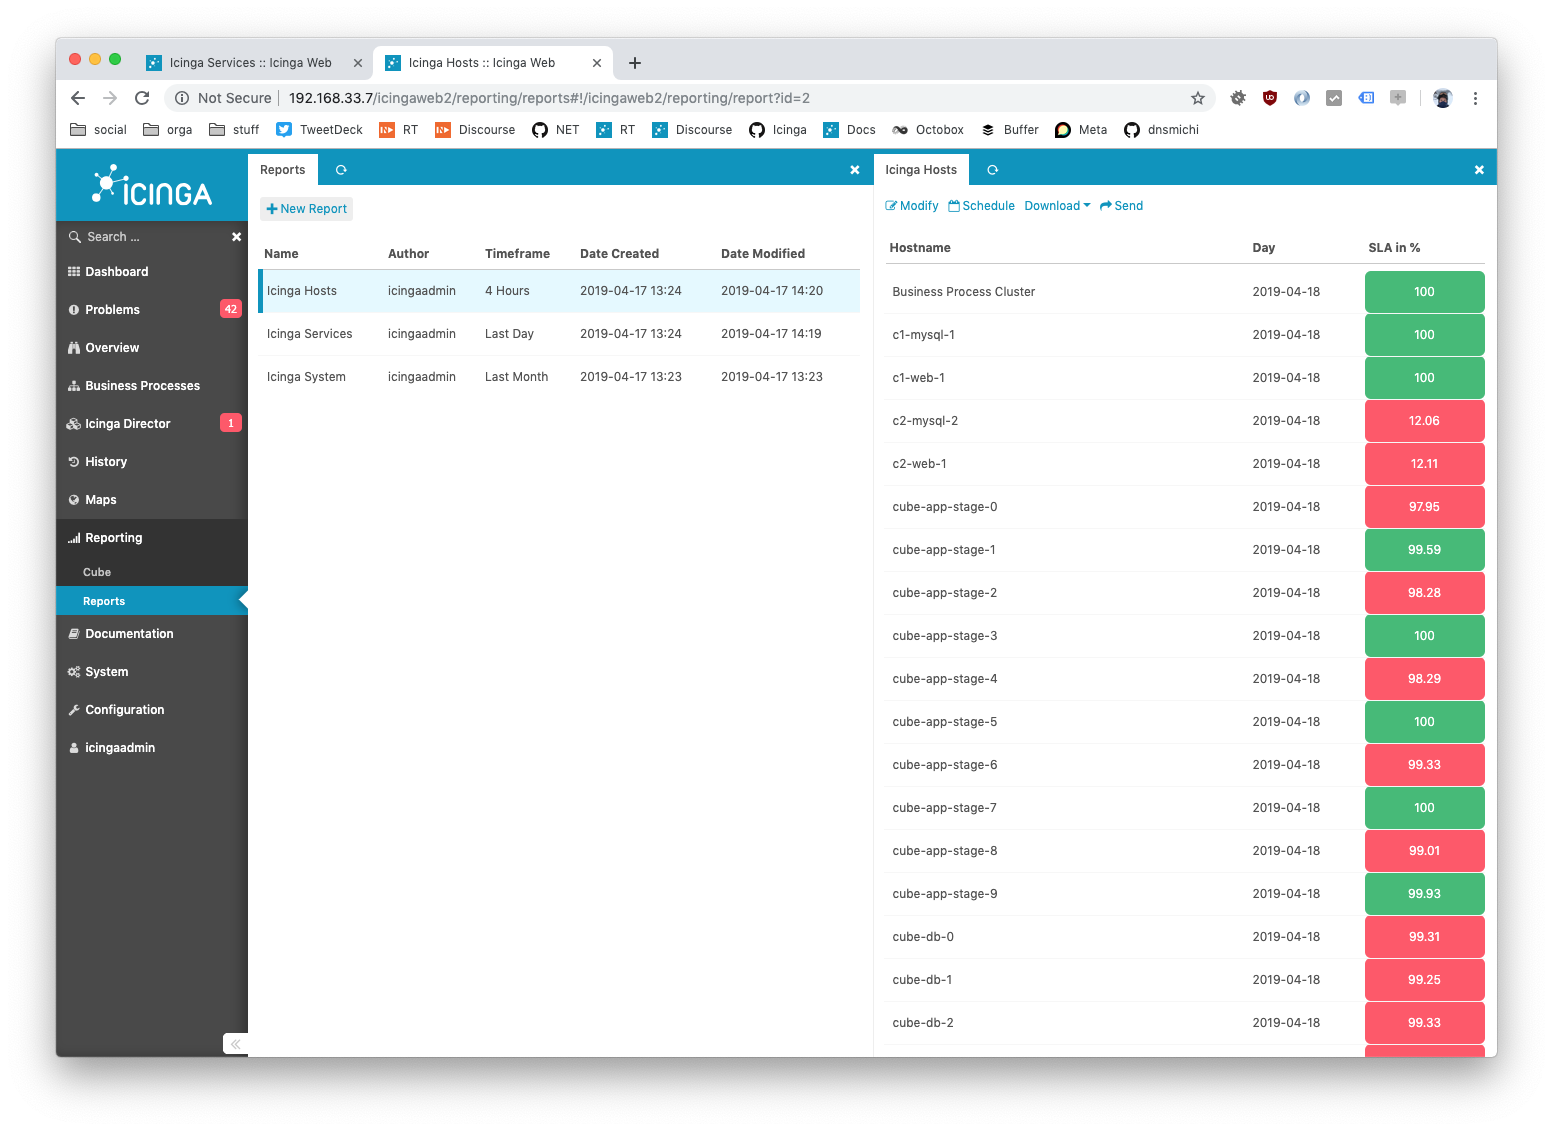
Icinga’s free computer systems and network monitoring software allow you to monitor your network’s available systems. It supports different types of alerts. It can also provide you with a database for your service level reports. Icinga, whose history began in 2009 as an offshoot of the Nagios monitoring system with the release of Icinga version 2, is completely free from the Nagios core’s shackles. It’s faster, easier to configure, and significantly more scalable.
6. Datadog
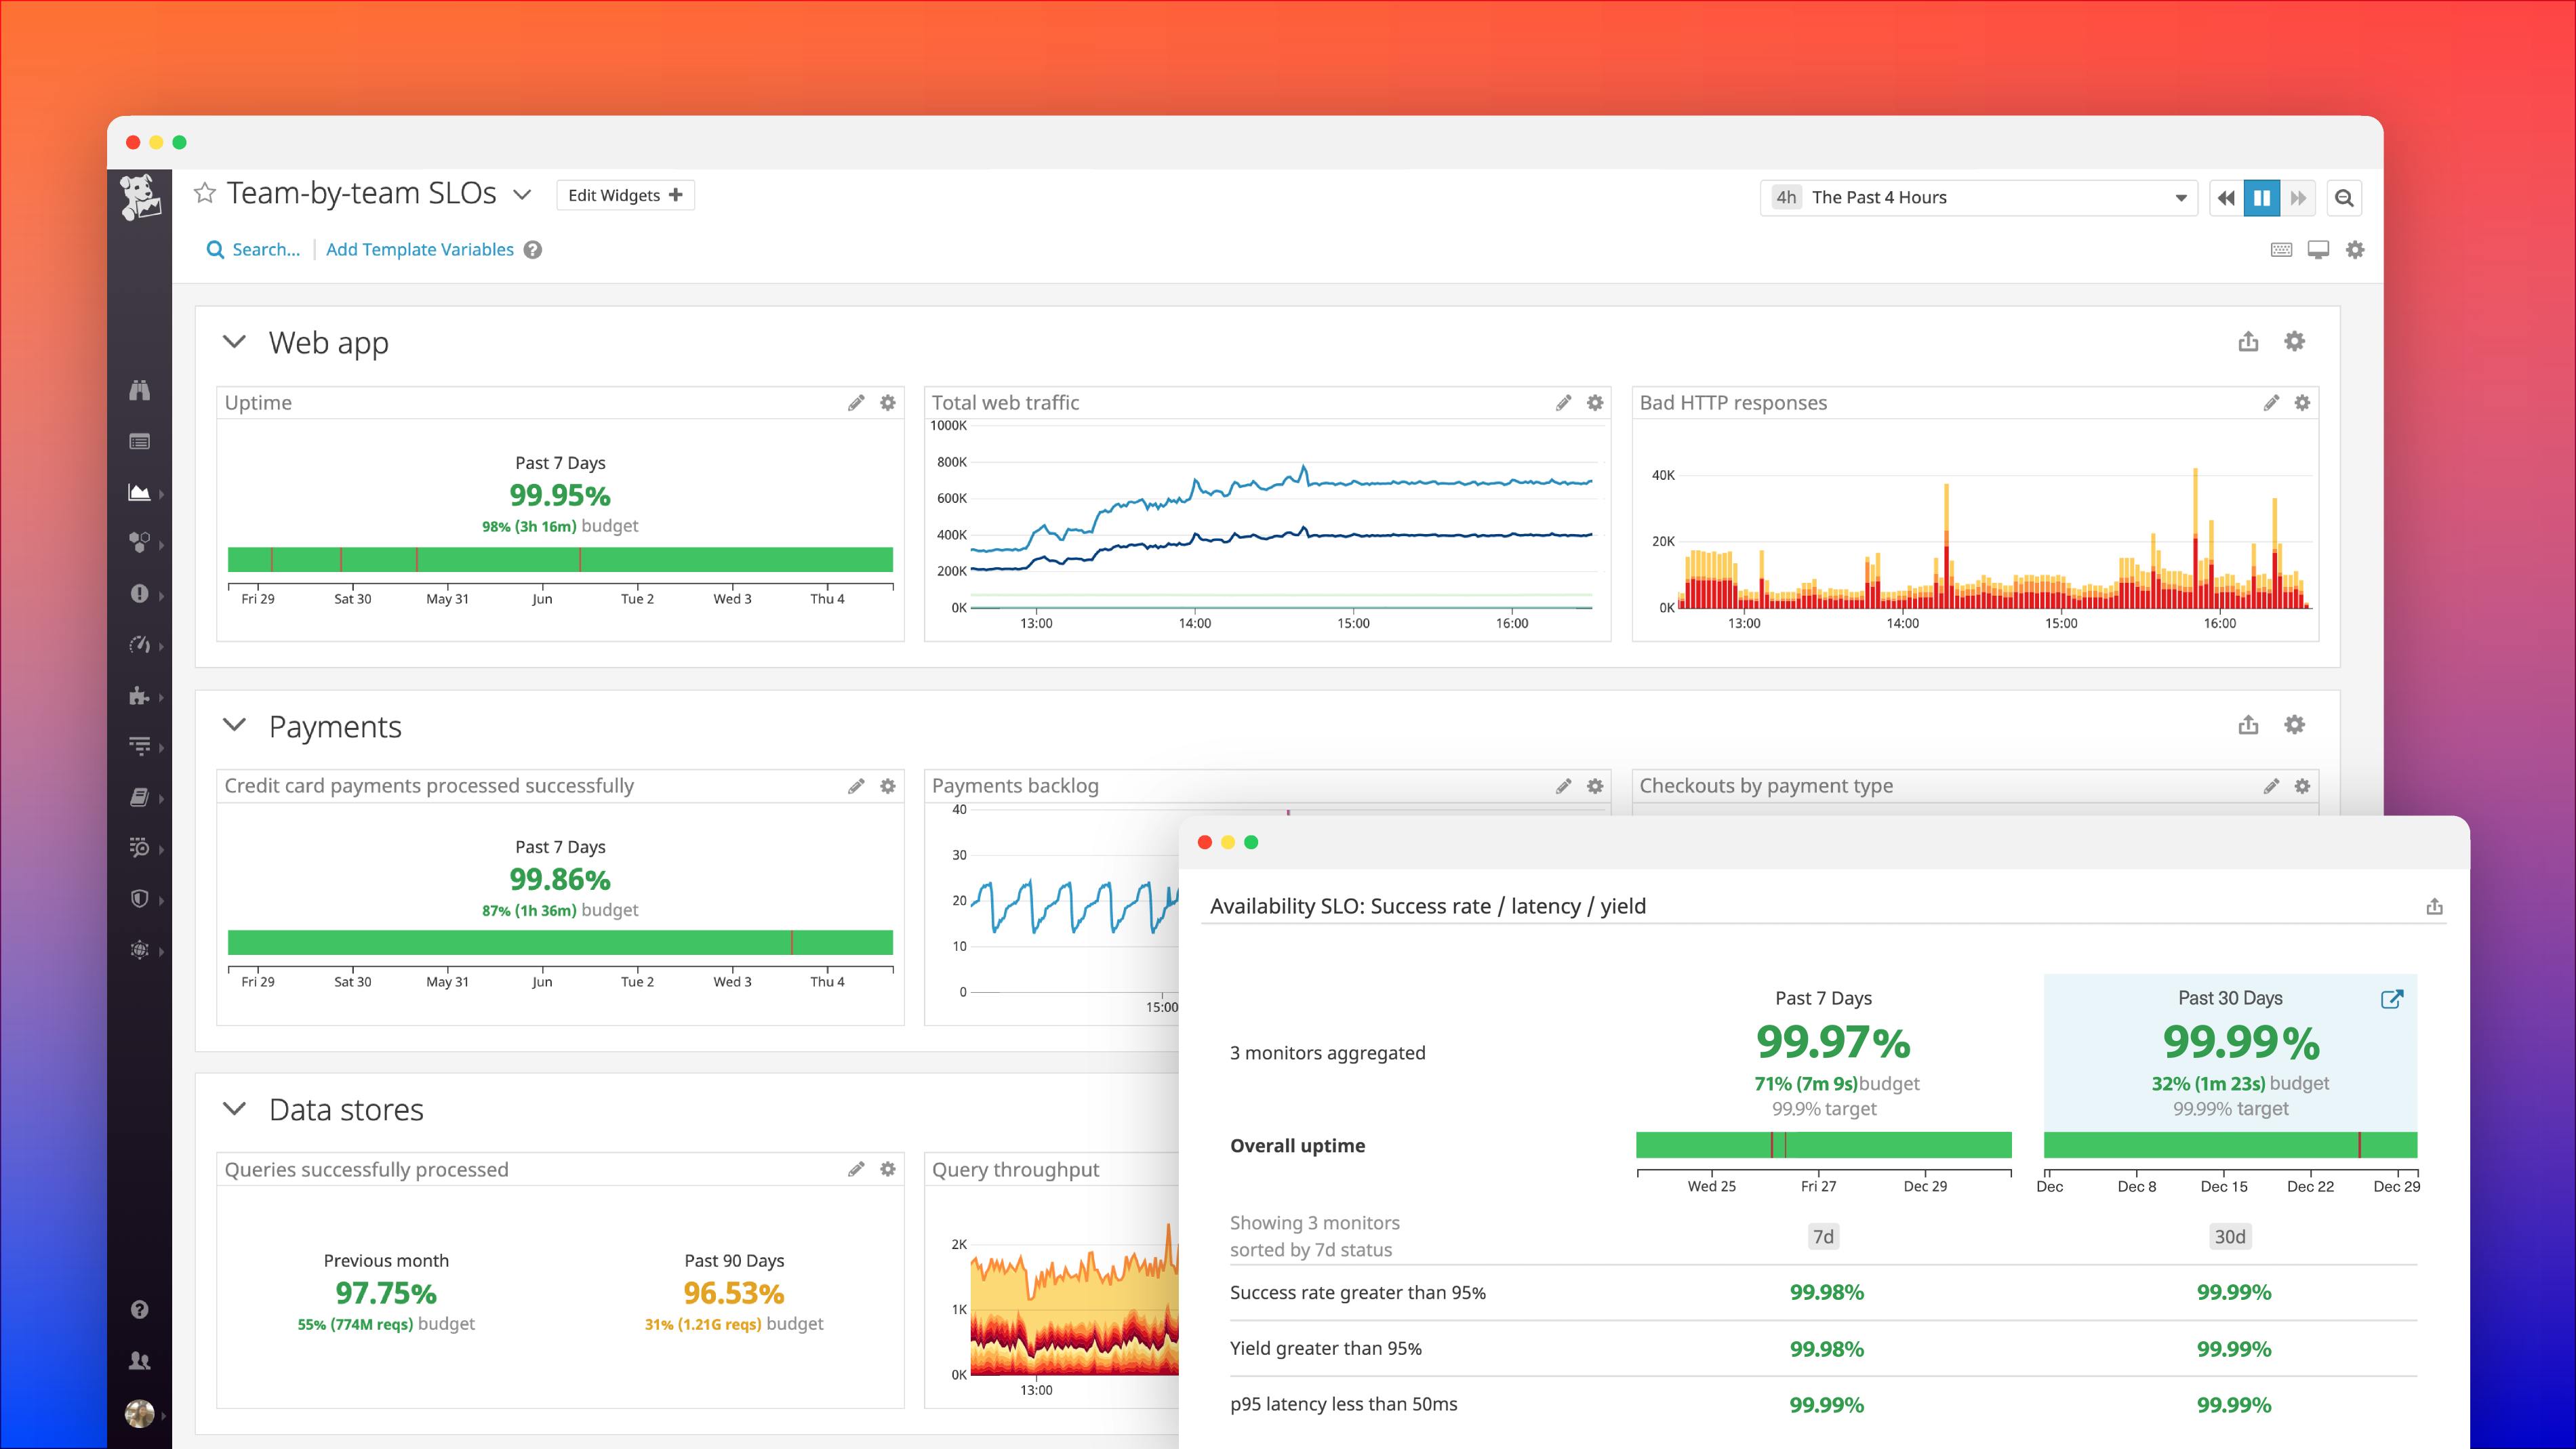
Datadog focuses on presenting an integrated view of an IT team’s tools and services across development and operations and delivering the right information to the relevant team members.
In addition to its out-of-the-box functionality, Datadog is designed to aggregate data from other applications, cloud providers, and specialized management tools, spanning the entire lifecycle from code change to deployment. It includes monitoring alerts with a consistent end-to-end data model.
7. Paessler PRTG Network Monitor
For networks of all sizes, IT infrastructure monitoring is critical for ensuring network devices are healthy while avoiding “zombie” devices and protecting against malware and other security threats. However, IT infrastructure monitoring is not a one-size-fits-all proposition. Different size networks have different needs, not to mention budget restrictions. For smaller organizations or organizations new to IT infrastructure monitoring, solutions with free and paid options can be a great way to get comfortable with IT infrastructure monitoring processes and tools, then grow solutions with paid options as networks and monitoring needs grow.
We feel PRTG Network Monitor by Paessler can be an excellent tool for small and growing organizations, offering free and paid versions with different capabilities. One of the more popular free options, the network monitor, is an all-in-one, basic solution for covering bandwidth, network, VM, server, and application monitoring. However, though PRTG is easy to install and use, we think its dashboard and user interface are not as simple and easy to use as other options with cleaner aesthetics, which can affect the accuracy and speed of interpreting data.
In addition to its basic monitoring capabilities, PRTG has various reporting utilities, a web interface, and alerting capabilities. We believe one of the most valuable features of a network monitor is a customizable alerting system, and the alerts in PRTG are flexible and can be transmitted through SMS, email, or push notifications via mobile applications. Though PRTG primarily focuses on agentless monitoring via SNMP, WMI, SSH, and other protocols, the network monitor is built to provide an agent IT admins can install on devices they want to be monitored.
Because of the sensor-based approach in PRTG, organizations can also build solutions tailored to unique needs. The first 100 sensors are free, and a 30-day free trial of the unlimited version is available on the website.
Conclusion
No matter what type of business you have, managing application performance is an essential task for the IT department. In online businesses, applications offered to visitors are the only contact customers have with the organization, so guaranteed application performance is essential. Even for other types of businesses, application performance remains a crucial element of the IT system.
Avoiding problems will keep the business running and reduce the number of calls to the help desk. You don’t want to rely on system users to know when your business applications are experiencing problems. If users even begin to notice bad service, a mistake has already been made.
Stay on top of your app’s performance with one of the tools on our list.
This post was written by Daniel de Oliveira. Daniel is a full stack developer and analyst, experienced with Java, Angular, and Flutter.