
Network management systems allow organizations to automate configuration tasks, monitor network health, and proactively troubleshoot issues. However, most organizations pay a hefty amount on typically packaged network management systems. No doubt these packaged systems possess several essential functionalities but spending a significant amount of budget on products the business will likely never use doesn’t sound a great deal. With growing requirements and leaner IT budgets, network administrators look for more economical solutions instead of purchasing “enterprise-level network package systems” that charge you more than what you need. One of the best ways is to invest in network management tools with a high return on investment (ROI) and low total cost of ownership (TCO).
Significance of Network Monitoring Tools
Networks have evolved from a handful of elements to more complex designs with advanced technologies and devices. Network monitoring tools allow admins to know about the overall network’s health, performance, and potential issues. To ease network monitoring and management, having real-time network statistics is crucial. The role of network monitoring protocols is to provide the essential stats and crucial information regarding various network activities. They’re designed to facilitate the tracking of data and traffic flowing to and from the network links (host and client). The data collated by the network monitoring tools using standard protocols is displayed graphically to help admins use the information in managing a network’s activity.
Standard Network Monitoring Protocols
There are several network monitoring protocols with distinctive functionalities. The basic function of the following network monitoring protocols can be categorized into five actions: mapping, monitoring, discovery, notification, and report. Outlined below are the standard protocols used in network monitoring.
Simple Network Management Protocol (SNMP)
SNMP is an application layer protocol under the Transmission Control Protocol/Internet Protocol (TCP⁄IP) protocol suite. It’s a professional-grade and widely accepted protocol to maintain network elements. It’s used for exchanging and extracting management information shared between network devices such as switches, modems, WLAN controllers, and routers. The information gathered is used to monitor the performance of the network based on bandwidth utilization, status of the interface, latency, and CPU usage. Most network elements are bundled with SNMP agents for better communication with monitoring systems, however, they need to be configured before use. The role of SNMP agents is to respond to queries, carry out requests, and indicate the event has occurred on the host running the network resource.
Internet Control Message Point (ICMP)
Unlike SNMP, which is used for the exchange of data between servers, ICMP is only used for error reporting. It’s a component of the TCP/IP protocol stack used for sending control and error messages. It helps determine if the data has reached its destination successfully within the expected timeframe. This protocol is used by network devices such as routers to send error messages. It also performs network diagnostics and operates both the terminal utilities (traceroute and ping). Messages sent by ICMP are relayed as datagrams to provide connectionless communication across a packet-switched network. This helps you quickly understand the cause of the errors. A few examples of error messages ICMP reports include:
- Source quench messages (An unusual increase of packet transmission)
- Time to live (TTL) exhaustion message (Packets TTL hitting 0)
- Unreachable destination message (error message sent by the destination host on the unavailability of the port due to hardware or any other failure)
- Parameter error message (packet mismatch or unapproved packet)
Some Common and Best Practices for Network Monitoring
Without a well-designed network monitoring plan, even the smallest issues can bring down the entire organizational network. Monitoring is one of the most critical aspects of networking, so having network management and monitoring strategies in place is crucial. Continuous monitoring helps enhance network performance by identifying and resolving issues faster with less mean time to resolution (MTTR). Organizations and network admins follow a few standard practices while implementing a network monitoring solution. These practices help in collecting the information about nodes and different parameters required for error handling.
Network monitoring isn’t limited to common practices, some best practices also need to be implemented in a business’s IT infrastructure. While common practices focus on the basic components of the network, best practices help plan an effective network monitoring guideline.
Network Monitoring Common Practices
Disk Monitoring
Organizations store sensitive information on storage arrays with multiple disks. Disk issues can lead to serious consequences for business continuity. Disk monitoring helps assess I/O operations of logical disks. With I/O disk monitoring, teams can set threshold limits to get alerts when these network metrics reach a critical level set by organizations or teams.
- Writes/sec—the rate of write operations on the disk
- Reads/sec—the rate of read operations on the disk
- Queue length—the number of requests pending on the disk when performance data is collected
- Busy time—the percentage of time at which selected disk drive is busy reading or writing requests
Disk monitoring helps in monitoring disk performance for errors, effective space utilization, free space, large file stats, changes to disk space usage, and I/O performance. Effective disk monitoring can help reduce downtime and detect storage-related problems.
Availability Monitoring
Businesses need their IT infrastructure to maintain 24/7 availability to meet growing demands, so availability monitoring—the monitoring of all the networking elements and resources used in an organization to ensure business continuity—is crucial. Availability monitoring helps admins know resources like firewalls, switches, and routers are running smoothly and are available. Availability monitoring helps track storage space, bandwidth usage and consumption, and system-level services. Technologies used for availability monitoring are:
- Ping: To track the availability of the active devices on the network
- IPSLA: To measure the availability of WAN links and their capacity to carry specific services
- Telnet: To check device availability when ping is blocked
- SNMP: To measure the current status or availability of a service on a device
- WMI: To check the availability of services running on Windows devices
Networking Hardware
Several hardware devices are involved in networking for storage, routing, application servers, and connectivity. The networking hardware is like a backbone helping sustain the entire IT infrastructure. Any sort of hardware failure leads to severe network issues. Therefore, hardware monitoring is a must to ensure the smooth functioning of the network. Monitoring multiple metrics regularly can eliminate network issues and maintain hardware health.
- Fan speed: Fan speed monitoring ensures the fan is working and balances the cooling required to maintain the hardware device temperature.
- CPU: Checks CPU utilization value.
- Temperature: High temperatures impact the performance of a device.
- Power supply status: Any unusual spike in the power supply can lead to various unwanted instances such as device malfunction and network downtime. Alert-based monitoring helps track potential issues.
Interface Monitoring
Interfaces such as Gigabit Ethernet, Fast Ethernet, and high-speed fiber channels are generally used in a network. The interface is responsible for the data packet transmission acting as an entry/exit point. Interface failure can occur from data packet loss, device errors, and utilization limits. Interface monitoring helps check the interface resources involved in the network and can be done with a reliable interface monitoring tool collecting data related to network performance, bandwidth (utilization and consumption), and errors. The tool displays the final results on a single screen. Interface monitoring helps you monitor interfaces and resolve network performance issues proactively. Moreover, it provides detailed real-time reports on traffic, utilization, and various interface parameters.
Network Monitoring Best Practices
- Baseline Network Behavior
- Configuration Management
- Escalation Matrix
- Reporting at Each Layer
- Capacity Planning and Growth
- Implement High Availability With Failover Options
Baseline Network Behavior
Understanding the network’s normal behavior helps identify potential problems and understanding the baseline behavior of various elements like CPU utilization and the temperature of a core switch is crucial to detect deviations and act to avoid malfunctions. Knowing the threshold values of the network help administrators to set alerts and reminders, which aids in troubleshooting and preventing network downtime.
Configuration Management
Any changes in configuration, major or minor, can lead to serious network issues or data loss. Configuration management helps with proper configuration of the devices, routers, firewalls, and switches without affecting the system’s functionality. Configuration management can also be used for backup and to make the configuration changes in bulk. This saves time and prevents unauthorized changes that lead to data theft, hacking, and serious security lapses. A reliable network monitoring tool with configuration management capabilities help admins control user access and configuration changes.
Escalation Matrix
Escalation matrix is extremely important for organizations with large teams and multiple administrators for handling different aspects of the network. It helps resolve issues by notifying the relevant team about networking issues. However, if the alerts are ignored and the escalation matrix isn’t followed, it can lead to random work distribution, resulting in severe network issues such as slowdown and failures. While setting up monitoring and reporting, organizations need to plan the responsibilities of individual teams according to their expertise, so they can be alerted to issues. When the team or individual isn’t available to handle the query, it can be passed to another level. This reduces the time needed for analysis.
Reporting at Each Layer
The network has seven layers, also known as layers of Open System Interconnection (OSI):
- Layer 7 – Application
- Layer 6 – Presentation
- Layer 5 – Session
- Layer 4 – Transport
- Layer 3 – Network
- Layer 2 – Data Link
- Layer 1 – Physical
Data is transferred at each point via links, devices, and nodes when the networking layers communicate with each other. Different network elements work at different levels, such as IP addresses at the network layer, cables at the physical layer, and transport protocols at the transport layer. When a failure in a network occurs, it can happen at any layer or even at multiple points. Network monitoring tools offer multiple technologies to monitor all the network layers and different types of devices in the network. They can quickly detect and report issues such as application delivery failure, routing problems, bandwidth consumption, and hardware malfunctions, and can help resolve the problems.
Capacity Planning and Growth
As an organization grows, so does its IT infrastructure. When the number of employees increases, so do the of network devices, systems, storage, and WAN bandwidth. Monitoring systems and networks allows administrators to keep a check on resources, their utilization, and consumption. Various free monitoring tools can help in capacity planning. As every monitoring tool has a limit to monitor the number of resources and elements with specific configurations or installation, organizations can switch to licensed or subscription-based tools to fill the gap. These licensed monitoring tools provide advanced features with seamless functionalities. They can track networking elements such as memory upgrades, CPU utilization, and add-on installations to increase functionality. Instead of getting separate purchases and upgrades to monitor different parameters of the network, it’s advisable to have a network monitoring system in place with several features to keep a tab on organizational networking elements.
Implement High Availability With Failover Options
Monitoring systems are used to collect data from the devices. If there’s a network slowdown or failure, the monitoring systems can also go down, making all collected data useless and inaccessible for analysis. Having a monitoring strategy with high availability and failover options can be helpful in avoiding such situations. High availability ensures even if the network goes down, the monitoring system doesn’t have any single point of failure and is accessible throughout, providing sensitive data for detection and resolution. Another option is a failover to help in replicating and storing the data collected from the monitoring systems. We recommend setting up a failover system to easily fetch information required for troubleshooting when the primary system fails to work.
Best Network Monitoring Tools
Network monitoring tools primarily focus on performance monitoring, fault monitoring, and account monitoring. They’re also used to examine components such as applications and email servers. While there are several network monitoring tools available, choosing the right tool with in-depth research and tracking capabilities is a challenge. To narrow down the options, some top network monitoring solutions are outlined below.
1. Network Performance Monitor

SolarWinds® Network Performance Monitor (NPM) includes a wide range of features and is easy to use, scalable, and cost-effective. The tool installs fast and is extremely easy to navigate. It tracks network issues and notifies the relevant teams by sending informative alerts. Users can also customize these alerts based on simple or complex nested trigger conditions.
The tool provides over a hundred pre-built reports to help users understand critical network paths. NPM shows all the data related to devices, networks, vendors, and applications in single-page path analysis to quickly track and isolate network issues. Administrators can also schedule network performance and availability reports through NPM’s automation and customization features.
The exclusive PerfStack™ feature lets users auto-generate network visualization maps. Simply drag and drop the network performance data from multiple sources and place it on a single chart. It gives an overall view of network resources for better analysis. NPM also lets users perform hop-by-hop analysis of the network to remote services, creating wireless heatmaps.
2. ipMonitor
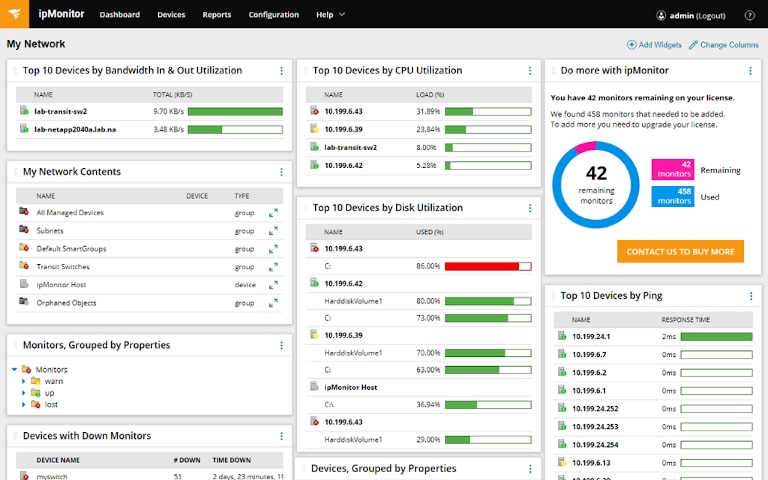
SolarWinds ipMonitor® is an out-of-the-box network monitoring solution designed to deliver visibility into the network performance metrics critical for IT infrastructure. It’s a fast, lightweight, and cost-effective solution and includes a built-in web server and database for faster resolution of issues. The tool uses standard SNMP and WMI for agentless, monitoring of applications and systems. It connects to a vast number of network devices and performs comprehensive tests, stores data in a local database, and alerts teams about the issues. ipMonitor generates network maps for unobstructed, at-a-glance views of your network environment. Users can customize alerts and reports to ensure teams know about issues as soon as possible. With zoomable reports, admins can view data for a specific time or event, which is useful in identifying the root cause of failures.
3. Nagios
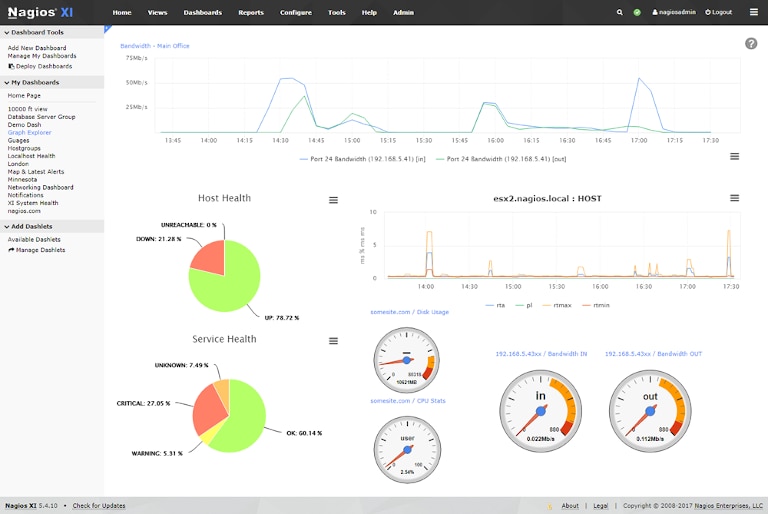
Nagios is a powerful monitoring system to detect and resolve issues affecting critical business processes. Nagios comes in two different plans. One is a free, open-source version limited to monitoring capabilities. Nagios XI is a commercial network monitoring version capable of performing several functions with added features. This version is accessible due to its external plug-ins. It gives a centralized view of the entire IT infrastructure, including detailed device status information. The tool has escalation capabilities and proactively monitors the capacity to measure network downtime.
4. PRTG
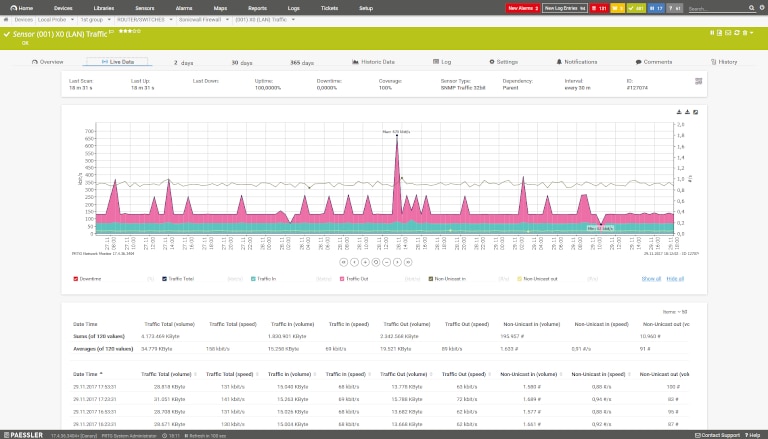
PRTG is a reliable and widely used network monitoring solution to help teams increase network efficiency by knowing the exact resource and bandwidth consumption of organizational devices. It ensures the computer systems are running smoothly and are free from outages. It can find otherwise undetectable system failures, reduce server performance problems, and proactively focus on improving the quality of service. Features of PRTG include comprehensive sensor type selection, remote management via a web browser, PocketPC, or Windows client, multiple location monitoring, alerts, and notifications for outage via email, ICQ, pager/SMS, and more.
5. ManageEngine OpManager
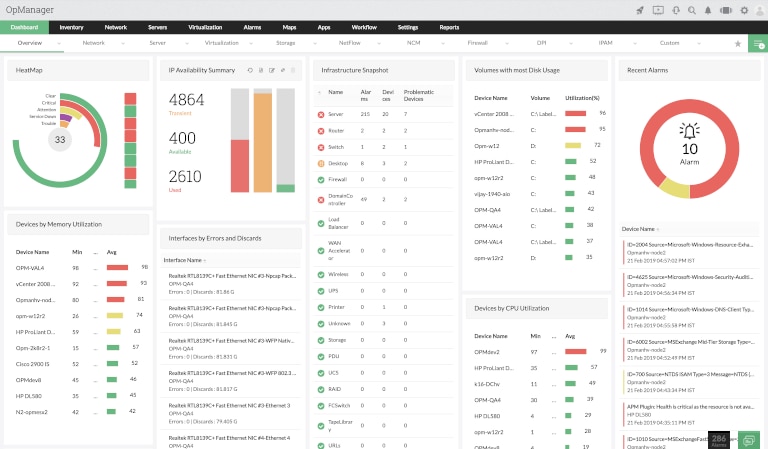
ManageEngine OpManager is a network monitoring system that acts as a backbone of organizational networks at difficult times. It helps IT pros anticipate potential outages and address network problems proactively. It maintains a congestion-free network, so businesses can run hassle-free. The tool monitors IP-based devices and network services, so teams can remotely visualize system performance, including components like switches, routers, and traffic flow. Features of ManageEngine OpManager include:
- Monitors WAN link availability
- Checks VoIP call quality across WAN infrastructure
- Visualizes automatic L1/L2 network mapping
6. NetFlow Traffic Analyzer
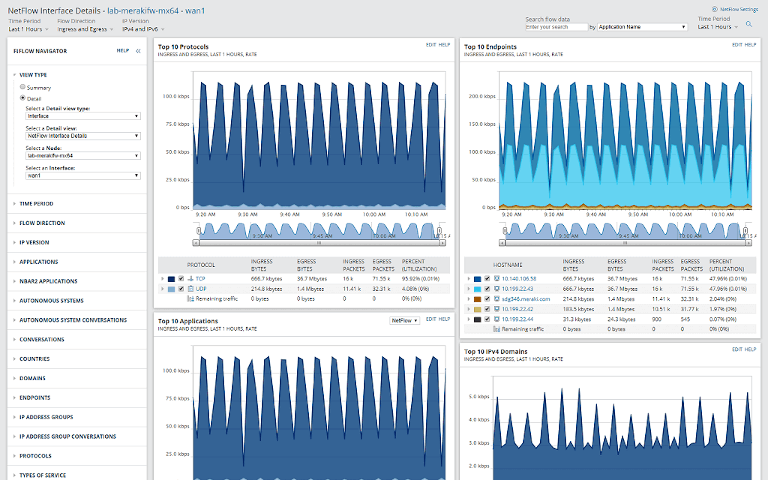
SolarWinds NetFlow Traffic Analyzer (NTA) is a network monitoring system dedicated to network bandwidth usage. It uses flow technology to identify and monitor network bottlenecks and represent the information in customized reports. It also sends threshold-based alerts via SMS or email to understand the severity of issues. The tool is quick to detect and troubleshoot network anomalies. It helps IT teams plan and organize future bandwidth needs based on the existing bandwidth usage patterns.
NetFlow Traffic Analyzer helps to:
- Get instant alerts and notifications in case of an emergency
- Measure bandwidth usage by application, interface, and conversation
- Follow historic bandwidth trends for capacity planning
- Real-time resolution of the bandwidth issues by finding the root cause of the issue
Summing Up
Network monitoring tools are a must-have to keep networks organized and well-maintained. They provide the visibility to manage your devices and ensure they’re highly available for the organization and its users. Several network monitoring tools highlighted above can be chosen based on the specific requirements. SolarWinds NPM is worth downloading its free 30-day trial. It makes monitoring hassle-free for enterprises of any level small, medium, and large. The tool has all the essential features, including network maps, autodiscovery, bandwidth monitoring, dashboards, and an alerts system. SolarWinds ipMonitor is another alternative that’s highly configurable, scalable, and is available to try out free for 14 days.