
In modern organizations, IT teams have to maintain a delicate balance between security, connectivity, and productivity needs. Defining stringent policies with multiple groups to meet different internet connectivity needs of teams in the office is rarely a one-time process. IT admins are often burdened to exclude or include new members or change access rights and rules. Amidst all these routine processes, they also have to ensure mission-critical or time-sensitive applications (e.g., VoIP-based video conferencing, e-commerce, cloud-based applications) don’t face any latency or jitters. This is where smart bandwidth management tools and QoS policies are required.
What is QoS?
QoS (Quality of Service) refers to all such mechanisms or tools ensuring critical applications requiring real-time data (usually audio or video) get sufficient dedicated bandwidth, with priority over other applications. The primary goal of QoS is to manage packet loss and reduce latency and jitters in your network connection.
Time-critical data transfers commonly use the UDP protocol. Unlike TCP, UDP protocol doesn’t retransmit the lost packets in transit as it is connection-less. So, during an IP call, if few audio packets get lost in transit, they won’t be retransmitted as due to disruption, the voice quality becomes irregular and unintelligible.
To tackle such scenarios, network admins need to identify applications requiring higher priority over bandwidth on a network. This is done by identifying the traffic. Some of the common ways to identify or mark the traffic include Class of Service (CoS) and Differentiated Services Code Point (DSCP). Different applications are marked based on the sensitivity of the information they carry. Marking applications appropriately will allow the network to categorize and prioritize data into different groups.
After the data is categorized into different groups, QoS policies are applied to those groups requiring preferential treatment over others. This is known as queuing. Once the data is tagged, and the policy is created, the main job of routers or switching devices is to automatically move these packets to the front of the queue and transmit them immediately without any delay.
QoS transmits data from one node to another in a store and forward manner (also known as hop-by-hop configuration). This kind of arrangement allows the data to be safely transferred from source to destination even if the nodes aren’t connected permanently. QoS policies can be configured to identify and prioritize RTP (Real-Time Transport Protocol) packets. RTP specializes in carrying and handling real-time transmissions of audiovisual data. QoS also allows admins to tweak traffic flow on LAN and WAN connections.
Admins need to remember QoS can only function properly if the connected devices between the sender and receiver are configured to understand the priority of packets. The devices should be programmed to understand the priority of a VIP packet and know when to push them in the priority lane. QoS fails, and the packets lose their priority if any one of the devices in the network isn’t configured properly.
Top Tools for QoS Monitoring
- SolarWinds NetFlow Traffic Analyzer
- ManageEngine NetFlow Analyzer
- Paessler PRTG Network Monitor
- Nagios Network Analyzer
- Free or Open-Source Solutions
1. SolarWinds NetFlow Traffic Analyzer

SolarWinds® NetFlow Traffic Analyzer supports CBQoS (class-based quality of service) monitoring. It collects, analyzes, and provides real-time visibility into your network bandwidth performance. With the NetFlow traffic analyzer, you can gauge traffic levels easily and evaluate if your QoS policies have the desired effect. It offers an intuitive dashboard allowing admins to view vital information related to the status of the network by reviewing the network performance metrics. You can also create custom reports with a granular view of bandwidth consumption and detailed traffic analysis within a few clicks.
2. ManageEngine NetFlow Analyzer
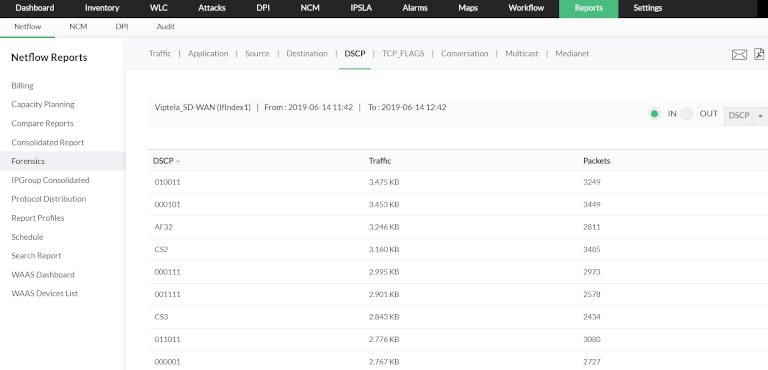
ManageEngine NetFlow Analyzer offers a detailed traffic analysis using flow-based traffic analysis methods. It supports S-Flow, J-Flow, IPFIX, and major flow technologies. While the tool can be used for detailed network forensics, application monitoring, and even capacity planning, it also offers in-depth bandwidth and QoS monitoring capabilities. You can get quick insights into your bandwidth with usage tracking reports updated every minute. With its enterprise edition, you can monitor distributed networks over a single console. Moreover, it also offers iOS and Android apps to monitor your enterprise traffic on the go.
3. Paessler PRTG Network Monitor
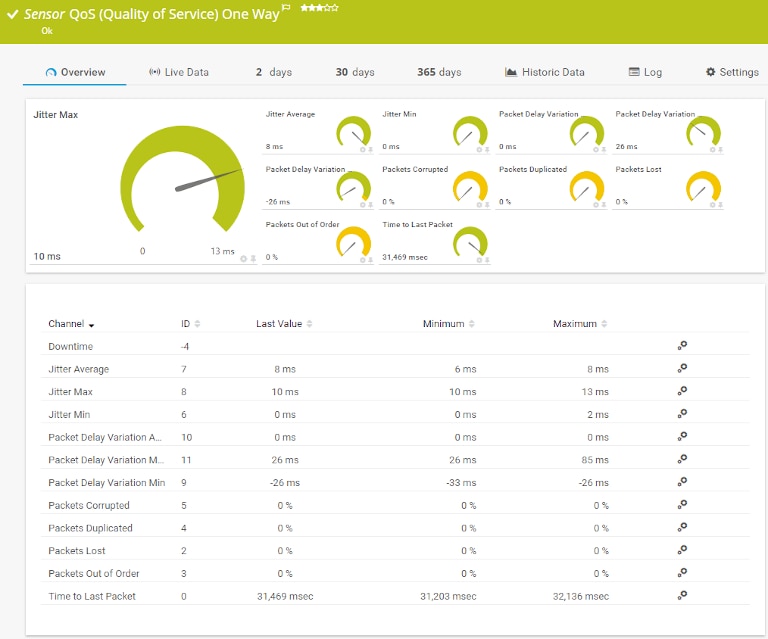
The PRTG Network Monitor is another tool popular among IT teams as it’s a highly scalable solution and meets the requirements of businesses of all sizes. It includes a dedicated QoS Round Trip sensor to track all VoIP traffic. You can choose from a range of bandwidth monitoring sensors to monitor packet loss, latency, and jitters. This sensor information can be viewed over different visual dashboards. With these dashboards, you can easily monitor which applications or users are hogging bandwidth and take remedial action. The tool can also be configured to raise alerts in case of network failures or protocol errors.
4. Nagios Network Analyzer
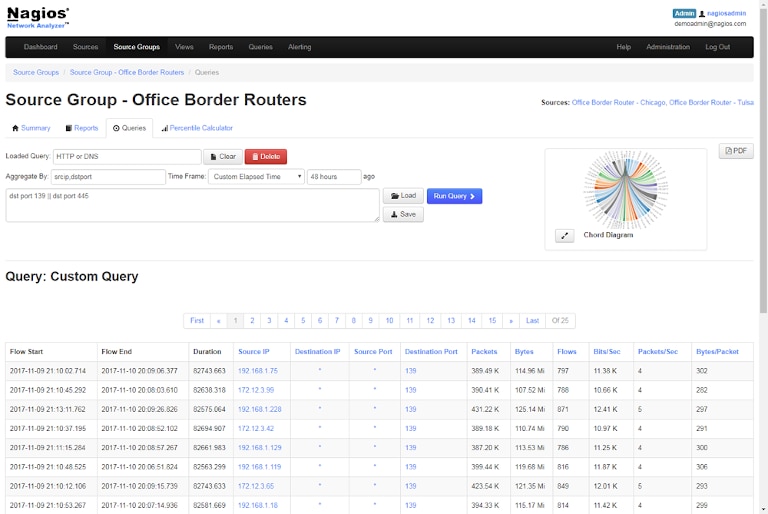
Nagios Network Analyzer is another bandwidth monitoring solution offering advanced NetFlow analysis with visual dashboards. The tool offers easy monitoring, whether you want a unified high-level view of your network or want to drill-down to specific connections and endpoints. You can gauge bandwidth consumption by source, IPs, or users. You can set up QoS baselines and easily detect if there’s any spike or deviation from the normal. You can also set threshold-based alerts to stay on top of your network. To get started, you can try out the 60-day trial version of Nagios Network Analyzer.
5. Free or Open-Source Solutions
You can also check out OpenNMS, ntopng, and bandwidthd, which are some free, open-source solutions for network monitoring and management. While these tools are used by IT teams across the globe, new users should keep in mind configuration challenges may arise at the time of installing these solutions. There’s a varying level of support and documentation available for all these tools, and in most cases, teams may have to spend considerable time and effort to set up end-to-end QoS monitoring. Any misconfiguration in QoS implementation or lack of effective monitoring can lead to network latency, loss of data packets, and jitters in the network. Therefore, take due caution before choosing any of these solutions.