
Businesses rely heavily on servers for data communication. Poor server performance hampers mission-critical tasks and may lead to data loss. Companies need to have the right set of tools to monitor physical and virtual servers and optimize their performance for a better end-user experience. Advanced monitoring tools provide real-time server monitoring and generate timely notifications in case of performance issues.
In the past, monitoring a server was a manual process where companies relied on their staff to log in to the servers, open individual logs, run commands, and identify the discrepancies in the output to spot the issues. However, with a large volume of server data and the need to analyze it quickly, companies now resort to automation. Automated methods offer a streamlined and centralized approach to improve or manage the performance of their server infrastructure.
Server monitoring is a process conducted by network administrators to monitor the working of all the available resources such as hardware/software. Metrics like CPU usage, RAM usage, hard disk space utilization, reporting, and server alerts can be monitored using a server monitoring tool. Depending on the server monitoring software you use, multiple layers of technology work in unison inside these software suites. These tools use some common protocols like SNMP, WMI, and ICMP depending on the environment and type of application they monitor.
Server monitoring tools allow the admins to understand the resource usage patterns of the system and optimize them accordingly to avoid issues. These tools can also be used to review login details of all users, suspicious activity on the server, and the status of the services. If a server monitoring tool is configured properly, it can help reduce downtime by controlling the operational costs, enhancing communication, and increasing productivity.
Server monitoring can have different objectives depending on the type of server. For example:
- Application servers are monitored for the availability of the server and their responses.
- Storage servers are monitored for space, data loss, and delay.
- Web servers are monitored for user load, security, and speed.
Server monitors can monitor several things related to the computing environment. Every server monitor has a different approach to solving the problems. Let’s look at some of the common applications of a server monitoring tool:
Uptime Performance Monitoring
Server uptime is a crucial metric related to the health of your servers. Server monitors periodically poll the server to record their uptime or downtime status. The monitors show server availability or uptime if the website or domain is available, and the devices and servers are functioning properly. A downtime means failures and issues in need of troubleshooting. Sometimes organizations also intentionally shut down servers for maintenance or upgrades, which can also reflect as a downtime.
Active Directory Monitoring
Active Directory (AD) server is a crucial server responsible for managing workstations and other devices inside enterprise networks. It’s a key server managing different domains, users, and objects within a network. With AD server monitoring, you track DNS errors, service failures, active threads, and other key metrics.
Resource Monitoring
Companies need to keep a close watch on available resources and how well they’re being used. An efficient resource monitor can keep a check on CPU usage and utilization of disk space, and can further monitor granular concerns, like fan speeds, temperature, and voltage. By closely monitoring all these metrics, you can spot the problem areas and rectify them quickly.
TCP/IP Traffic Monitoring
It’s not always an application bug or web server that leads to slow performance and poor user experience. Network issues arising from malfunctioning TCP server components can also lead to performance degradation. By monitoring TCP connections for latency and packet loss, you can get a quick overview of the quality and responsiveness of your TCP connections.
Database Monitoring
Database monitoring is a critical task for companies. Database monitoring software ensures databases are performing flawlessly without hampering the performance of the applications. You should keep track of database performance issues by continuous monitoring of key parameters like database and table size, cache hit ratio, active database and server connections, etc. They can also monitor areas where improvement is possible.
Email Monitoring
Email or mail server monitoring is essential to keep your mail servers up and running. Server monitoring tools can help you check the performance status of various mail transfer protocols, track server processes at the sender and user ends, and monitor storage capacity. By monitoring email delivery failures, along with variation in delivery speeds, you can identify bottlenecks in the systems and resolve issues.
Docker Monitoring
As more organizations adopt Docker containers for application delivery, it’s becoming crucial to monitor the cloud-based environment. Modern server monitoring tools can help you monitor different containers, hosts, and other infrastructure metrics to stay on top of your applications and resources.
How to Monitor Servers
While automation has simplified server monitoring to a great extent, it still requires a lot of heuristics-based monitoring and human involvement. As the server infrastructure and enterprise environments become more dispersed and complex, the definitions of “what is problematic” and “what is routine” are moving targets. In this scenario, administrators should define key metrics for gauging server health and constantly revise their baselines to set alerts and proactively respond to issues.
Identify Key Metrics
As discussed, you should identify key performance indicators related to your servers’ different functions and capabilities. We’ve listed some of these metrics below:
- Metrics for CPU Monitoring— process count, thread count, interrupt time, etc.
- Metrics for Memory Monitoring—free memory, page reads/writes per second, pool paged bytes, faults per second, etc.
- Metrics for Disk Monitoring—disk free space, reads/writes per second, disk transfers/second, etc.
- Metrics for Network Monitoring—packet errors (both outbound and inbound), kilobytes received per second, output queue length, etc.
In addition to monitoring the above general metrics of your servers, you can monitor database instance activity, user activity, and behavior of queries. Messaging also plays a crucial role in modern networking operations. Therefore, you should monitor email database response and mail server utilization. Again, web and application servers also involve their own set of metrics. A server monitoring tool will allow you to monitor all these metrics and present a holistic view of your environment. However, it’s important to prioritize and shortlist metrics based on your organization’s requirements and monitoring needs, which requires constant reviews and tweaks.
Establish Performance Baselines
It’s impossible to constantly monitor every metric manually, as IT teams are often overburdened handling different routine tasks and managing their environment with various dashboards. Therefore, teams should create baselines or define thresholds for alerts and notifications. This is easier said than done; some baselines (e.g., disk space) can be strictly defined, while others would vary based on workload patterns and time of the day. For example, what’s “normal” during work hours on a weekday can differ significantly from the normal baselines defined for weekends and nights.
As there are various approaches to determining a baseline, you should study and identify the best one for your organization. Alerts and notifications configured without a proper understanding of the environment can lead to alert fatigue. Server monitoring tools can deliver true value only when you have a team with years of experience in handling critical hosts, servers, and applications in live environments. Analyzing the metrics and log data can also give you some help in determining baselines.
Open-Source vs. Commercial Server Monitoring Tools
Open-source monitoring solutions are generally free, can monitor the common functionalities of a server, and help in identifying the root cause of errors. The code written in these applications can be easily viewed, shared, and modified by users and organizations globally. As there’s strong community support behind most of these solutions, organizations often install these solutions to meet their urgent requirements. However, scalability and configuration challenges often arise in the long run.
This is where commercial solutions have an advantage. Unlike open-source solutions, commercial monitoring tools usually come with dedicated vendor support and can meet scalability challenges easily. If you choose a SaaS offering, you can provision your solution in a few simple steps and make use of flexible subscription plans as per your requirement. Further, you don’t have to face any upfront costs in setting up the infrastructure.
Tips for Selecting the Right Server Monitoring Tool
Assess Baseline Infrastructure Requirement
While some enterprises have a significant on-premises footprint, others have a cloud-based infrastructure. Therefore, if you want to monitor on-premises servers, granular monitoring of hardware could be a key consideration and on-premises deployments could serve the purpose well. On the other hand, you may want to explore SaaS offerings for better scalability and ease of provisioning.
Consider Application Requirements
Before you choose a tool, make sure you have a fairly good idea of the behavior of the application to monitor. You must consider the way your application will perform if there’s low memory or insufficient disk space. Will it become unresponsive? What steps will you need to take? You’ll also have to set a timeline to rectify the errors.
Adapt to Changing Needs
As your organization grows, your requirements would also expand, both in terms of scale and complexity. Most organizations have already virtualized a big portion of their IT infrastructure, and modern microservices and container-based application architectures have made big ripples in the server monitoring space. While your organization updates its systems and practices, keep track of your organization’s readiness for monitoring and preventing IT sprawl.
Understand the Pricing or License Structure
It’s important to understand every component of software and how it’s billed. You might be charged based on the number of applications monitored, user accounts, components connected, and so on. A PoC will give you a better understanding of RoI. Most vendors offer a wide range of features at nominal prices to acquire new clients or conduct PoCs. However, you might discover different kinds of restrictions on key functionality, forcing you to pay more than what you might have initially assessed. It’s important to list all such factors in initial cost assessment.
Add Your Training Costs
Many times, organizations fail to account for the time and costs involved in the initial configuration, troubleshooting, and employee training. The support offered by the vendor can only go so far in resolving the technical issues. Certain server monitoring software has a steeper learning curve than others. You need to assess the software’s learnability along with your teams’ readiness to adopt a new solution.
Top Server Monitoring Tools
Let’s look at some of the most popular server monitoring tools available in the market:
- SolarWinds Server & Application Monitor (SAM)
- SolarWinds Virtualization Manager
- Applications Manager by ManageEngine
- Monitis
- Nagios XI
- SolarWinds AppOptics
1. SolarWinds Server & Application Monitor (SAM)
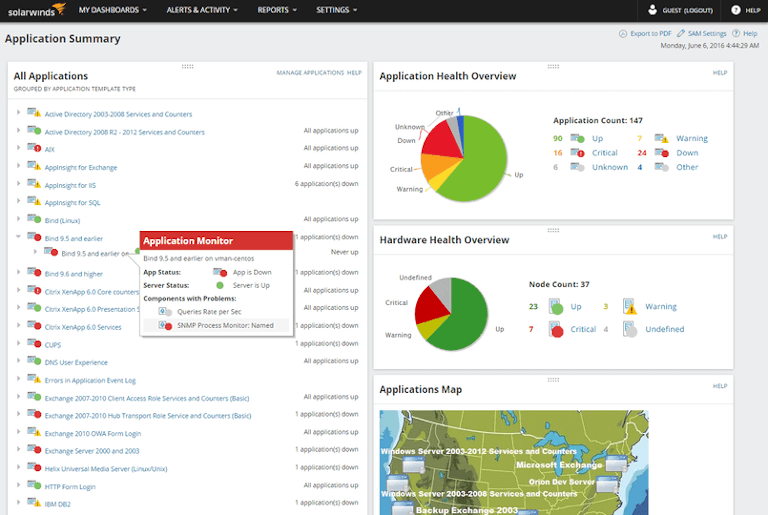
SolarWinds® Server & Application Monitor (SAM) offers one of the most exhaustive sets of features for monitoring servers and applications in modern distributed environments. It can run on local area networks and cloud environments. The tool supports Azure, AWS, and all common SaaS, IaaS, PaaS deployment models.
Using this tool, IT teams can monitor applications and key services on both Windows and Linux Servers. Issues related to hard disk space, CPU utilization, and other key areas can be resolved quickly. The presence of a unified dashboard lets the admins monitor resource allocations and spot the areas in need of immediate attention. Admins can go to the root cause of problems by analyzing the collected data. SAM is easy to install, and it’s easy to use this tool in different environments. The tool also provides more than 1,200 templates to support various applications for monitoring. You can get a fully functional version of the software for free for a 30-day evaluation period.
2. SolarWinds Virtualization Manager
SolarWinds Virtualization Manager is one of the best tools to monitor virtual machines and optimize their performance issues. The ease of provisioning a virtual machine is often challenging, as teams spin up VMs in abundance, leading to VM sprawl. With Virtualization Manager, you can control this sprawl by shutting down idle VMs, deleting powered-off VMs, and more. The tool also facilitates capacity planning, helping you make the most of your virtual resources. VMAN provides you with advanced visual dashboards to monitor AWS, vSphere, Hyper-V, and Azure server environments. You can also get a free trial (full functionality for 30 days) of the Virtualization Manager here.
3. Applications Manager by ManageEngine

Available on a 30-day free trial for Windows and Linux, ManageEngine Applications Manager is an application and web-server monitoring tool that allows system administrators to monitor virtual, physical, and cloud environments from a single point. Applications Manager monitoring tool is perfect for those organizations with different servers in their operating environment and cannot afford any downtime. The tool allows the users to review uptime reports, storage utilization, and resource allocation for an application or for entire servers from a single point. It allows admins to customize the dashboard and reports for a better understanding of the data. You can also configure automated notifications and alerts to rectify a flaw immediately.
4. Monitis
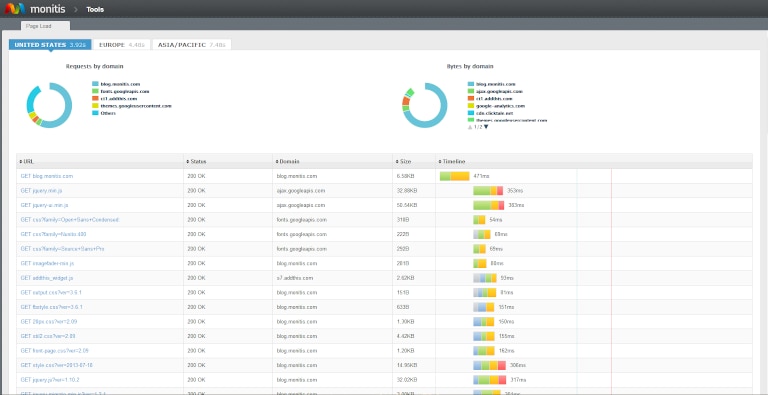
Monitis is an online solution to monitor the overall health of web servers and websites. If there’s a failure, Monitis sends custom alerts and warnings to the users through SMS, email, Twitter, or via phone. The web-based interface makes it easy for users to retrieve the information instantly using a simple tab-based system.
This tool can be used to gauge the overall performance of online servers. Admins can monitor the data collected and take the necessary steps in advance to resolve issues before they become big problems.
5. Nagios XI

Nagios XI, a comprehensive and centralized IT infrastructure monitoring application, provides information about all the available resources in your computing environment like servers, networking components, services, networking appliances, and protocols.
Powered by the Nagios Core 4 engine, the tool allows the users to gain in-depth insight into the performance of the server, network protocols, applications, and other related services. Nagios XI also supports hundreds of third-party plugins that can be installed for extra functionality.
The platform has a customizable GUI, so users can create the best layout and design for better understanding. Nagios XI allows admins to monitor individual components of a server to keep them up and running without any snag. The web interface is easy to install and can be set up in any network. Depending on the requirements of the organization, the dashboard can be customized to view the required information related to the servers and other components.
6. SolarWinds AppOptics

SolarWinds AppOptics™, another well-known monitoring tool by SolarWinds, has gained popularity due to the advantages it offers. AppOptics is a paid application focused on server and infrastructure monitoring, along with application performance management. It’s an all-round monitoring solution for your servers and can provide a deep insight into the applications by defining custom metrics. AppOptics allows you to review the performance of the server by creating easy-to-understand graphs and customized dashboards. The tool provides different application integration support for AWS, Apache, and other platforms. AppOptics can be customized fully as per the requirements of the organization. Check out the free trial to get accustomed to the solution.
Free Server Monitoring Tools by SolarWinds
1. Server Health Monitor
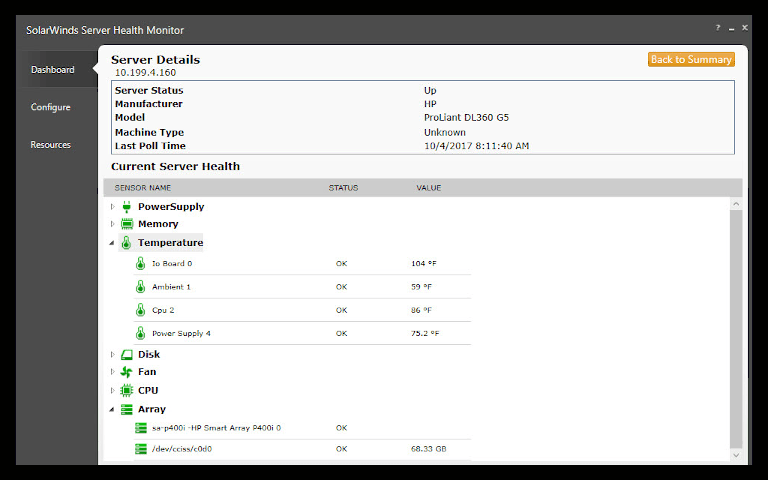
Companies can use SolarWinds Server Health Monitor to check the overall health of their server hardware components. The free tool is ideal for small organizations looking to monitor hardware status and performance of up to five servers. It supports monitoring of servers from leading vendors, including Dell, HP, IBM, and VMware. You can monitor key metrics of different hardware components, such as battery charge, power supply, fan speed, and temperature. You can also define threshold-based alerts to stay on top of your environment.
2. Storage Performance Monitor

SolarWinds Storage Performance Monitor is another free tool useful for smaller IT setups. As the name suggests, this tool allows admins to keep a check on the available and used space on the server. The data collected by this tool can help the admins to resolve space-related issues and allocate the available space optimally.
3. Exchange Monitor

Every organization uses emails for communication, and most corporate mail servers are run on Microsoft Exchange. SolarWinds Exchange Monitor is a free tool with support for Exchange servers. With this tool, you can monitor the status of critical exchange services, performance metrics, availability status of the database, and customize threshold-based alerts.
4. Database Performance Analyzer

Databases are an important part of every business-critical enterprise application. SolarWinds Database Performance Analyzer is a free tool that lets the admins monitor the response times of a database without installing any agents. At the same time, they can also keep a close check on the available capacity, configuration, and performance of a query, query conflicts, and other factors that may cause problems in the future.
Conclusion
Every company has a different environment and must carefully invest in the right server monitoring tool as per their requirements. Although this article lists out some popular server monitoring tools, there are still more great products out there available in the market with similar functionality. Companies can also customize their server monitoring software choices according to their specific needs. They need first to understand the application, outline the metrics they want to monitor, and then choose the most suitable solution.
Also, the server monitoring tool must provide the ability to create custom and in-depth graphs, reports, and maps as they play a crucial role in business. The server monitoring tool should also allow companies to look back at the historical data and faults when troubleshooting an issue on a critical server or service.