
As businesses become more agile, they’re developing new applications, refactoring their monoliths for the microservices architecture, and adding new features more frequently. The DevOps teams responsible for the continuous delivery in this competitive environment, require a special set of tools and processes for monitoring their infrastructure and applications. Today, applications not only need 24/7 availability, but also have to perform well on several user experience (UX) parameters. Keeping track of the changes or features bringing improvements in the application performance, along with factors affecting an application’s health, has become highly crucial. However, traditional approaches for monitoring the network infrastructure provide little help in monitoring distributed applications deployed in container-based environments. In this article, we’ll discuss server monitoring vs. application monitoring; exploring the differences, and also how the two approaches align to help you get the most out of your applications.
What’s the Difference Between Server Monitoring and Application Monitoring?
Whether you’re using a web application server (Apache, NGINX, IIS, etc.) or an AWS EC2 instance, you need deeper visibility into the hardware to optimize it for better performance. This is where the server monitoring tools offer a way forward. With a server monitoring solution, it’s possible to monitor parameters such as disk health, CPU utilization, temperature, power supply, memory utilization across different processes, network connectivity, and more.
On the other hand, application monitoring works at a higher level and tracks a given application instance. Depending on the type of application (Java, Node.js, Ruby, Python, PHP, etc.), there could be minor differences in monitoring approaches. However, most application monitoring tools offer common methods to track the speed of execution of web requests, API calls, database queries, etc. with various error rates and response times/durations metrics.
The application monitoring also involves monitoring of different transactions. Most Application Performance Monitoring (APM) vendors offer distributed transaction tracing features to capture the flow of a request across a complex stack. It involves instrumentation of code and supporting components to capture issues from within an application. This is different from metrics-based monitoring, where business transactions initiated from a browser are measured in terms of site performance and usability parameters.
What Are the Most Important Metrics for APM?
It’s easy to get overwhelmed by the amount of information application logs and metrics can offer, so it’s advisable to focus on the most important transactions and corresponding metrics for application monitoring. The APM metrics can be categorized as follows:
Application Time-Series Metrics
Error rates, requests per minute, average response times, etc. are examples of application time-series metrics. These metrics are collected over a long period and with their analysis, teams can identify recurrent patterns and outliers. The analysis helps in predicting future server capacity requirements. Unlike logs and infrastructure metrics, which help in deeper troubleshooting, the primary use of time-series data is limited to the detection of trends and potential issues.
Infrastructure Metrics
As discussed above, server monitoring software helps to capture infrastructure metrics such as CPU and memory consumption, disk I/O, network I/O, and more. By tracking these metrics, teams can identify if their resources are going to peak or have excess capacity. Further, admins can set up threshold-based alerts using these metrics to prevent load shedding and failures.
It’s possible to track the performance and health of a stack at various levels using the metrics. For example, one can track the error rate at the transaction level to understand if a transaction is working smoothly. If the particular transaction shows a higher error rate, then it might require changes in the code or UX-related aspects. Similarly, tracking the count of application instances is crucial for provisioning purposes. For applications using microservices architecture, keeping track of metrics at the services level becomes crucial, as any slow-performing service can impact the entire application.
How to Select an APM Solution?
There are a wide range of tools available in the market and understanding the strengths and limitations of every tool with research and proof of concepts can take up time and effort. It’s recommended organizations seeking an APM solution should have a good understanding of their high-level and low-level requirements. While many APM tools offer code-level diagnostics, distributed transaction tracing, end-to-end visualization, and end-user experience monitoring, they vary in their support for different languages (Java, Ruby, PHP, etc.) and coverage of metrics. Ease of implementation is another major factor; you don’t want to spend too much time instrumenting your applications. Further, you should gauge the percentage CPU overhead due to the monitoring agent.
Why Should You Implement AppOptics for APM?
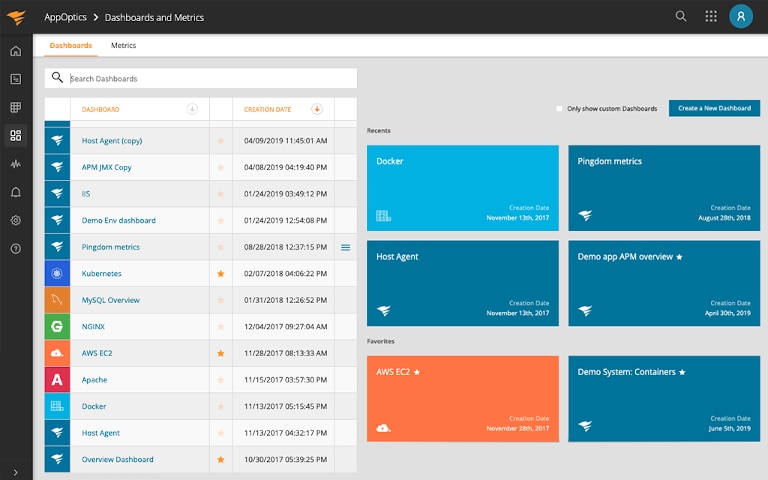
SolarWinds® AppOptics™ offers both modern infrastructure monitoring and application performance monitoring capabilities, giving you the flexibility to implement a solution based on your monitoring requirements. You can use more than 150 out-of-the-box integrations and plugins to monitor AWS and Azure infrastructure services, including different web servers, and databases. It covers 1000 custom metrics to provide instant visibility into different servers, hosts, and containers. With various pre-configured dashboards, you can also monitor your Kubernetes and Docker environments.
In addition to infrastructure metrics, AppOptics also offers distributed transaction tracing, live code profiling, and exception tracking features for end-to-end application performance monitoring. The solution is easy to implement and offers fast onboarding with auto instrumentation. This means you can start tracking traces and metrics without struggling with complex configurations. Further, AppOptics also easily integrates with SolarWinds Loggly® and Pingdom®, as part of its APM suite. By integrating AppOptics with Loggly or Papertrail™, you can get to the specific logs associated with a transaction to troubleshoot issues quickly.
Conclusion
We’ve evaluated leading APM tools and recommend SolarWinds AppOptics as the most effective, affordable, and simple solution in the market. Whether it’s a traditional monolith or a modern microservices-based application deployed over containers or serverless environment, AppOptics can help you get the most out of your applications seamlessly. Getting started with AppOptics is easy. Start a 14-day free trial now.