
Using service desk software can help you significantly enhance your team’s workflow. However, to maximize the value derived from an IT service management (ITSM) solution, it’s important to know which service desk metrics and Key Performance Indicators (KPIs) to track.
There are a handful of essential metrics you can analyze to boost accountability, increase productivity, and ultimately improve your organization’s bottom line through service delivery. Knowing which metrics to keep tabs on can also make it easier to gather and report relevant data to stakeholders and management.
In this post, we’ll briefly explain which service desk metrics are important, and provide a list of 11 key numbers to analyze and report on.
Why Service Desk Metrics Are Important
IT Service Management (ITSM) can help you automate incident management and streamline support services. However, when using service desk software, there can be a lot of data to sift through.
To ensure you’re being efficient and delivering the best possible service, it’s useful to know which service desk metrics are the most relevant. Establishing and narrowing down the numbers important to your organization can help with:
- Optimizing performance reporting and management
- Increasing transparency
- Uncovering common challenges
- Identifying opportunities for improvement
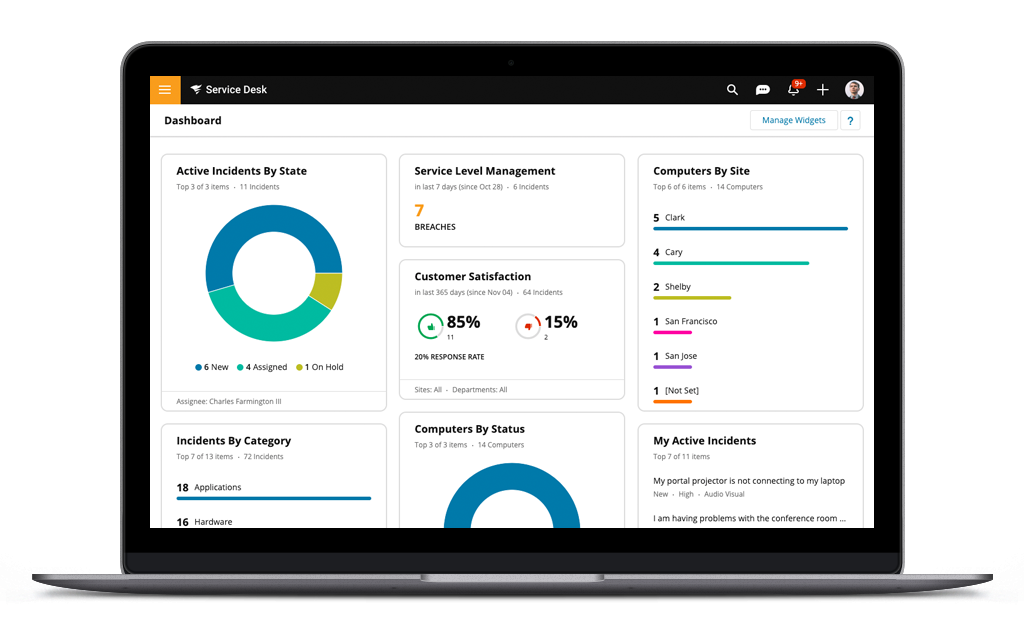
This information can also help you choose the most useful service desk software solution. For example, it’s smart to look for one that offers the option to create your own reports and can provide a high-level dashboard of key metrics, so you can focus on the details that matter most.
11 Key Service Desk Metrics to Analyze (and Report On)
Now that we’ve established why KPIs are important, let’s take a look at 11 metrics you’ll want to keep track of and include in your reports.
1. Ticket Volume
Ticket volume refers to the number of incoming support tickets and can help you better understand how a particular change might be received. For example, if there’s a significant spike in tickets after a change is rolled out, it may mean there’s room for improvement in knowledge base or training documentation.
Another reason ticket volume matters is because it can help identify when more support agents may be necessary. Once you know what your average or baseline ticket volume is, it becomes easier to pinpoint when the workload is increasing beyond a manageable point for your team.
2. Cost Per Ticket
Cost per ticket is a helpful metric for assessing the efficiency and performance of your service desk. To establish this metric, you can calculate your annual expenses for customer support, including items such as agent salaries and technology costs, and then divide it by the annual ticket volume tracked in your service desk software.
3. Incidents or Ticket Requests By Category
Monitoring incidents or tickets by category is a common and helpful method of processing requests faster and removing bottlenecks within ticket routing operations.
This is especially helpful if your business’ incident management processes vary by department (such as hardware, applications, human resources, or facility requests). Analyzing this metric on a regular basis lets you see which categories are receiving the most tickets, and more easily evaluate how they’re distributed. Spikes in certain categories might indicate a need for stronger self-service resources or knowledge articles. It can also help with agent responsibilities.
4. Tickets By Status
Tracking tickets or incidents by status (like new, on-hold, and assigned) is useful for evaluating technician performance and responsiveness. It’s an important service desk metric because it can help management determine whether internal support processes and operations need to be improved. Over time, the tickets opened and tickets resolved rates should run in parallel.
5. First Touch Resolution
The first touch or contact resolution rate is a metric you can track to see the amount of tickets resolved without being reassigned or escalated. It can measure how effectively tickets are automatically assigned. Poor first touch resolution might also indicate a need to collect more data from the end user up front. It fits hand-in-hand with customer satisfaction because it demonstrates how many requests are handled in one interaction or session rather than over multiple sessions.
6. Average Response Time
Average response time measures the total time between when a support request is made and when the first action of a service desk technician is documented. Tracking this metric is essential for ensuring agents are responding in a timely manner and to avoid harming customer satisfaction. Most users simply want their requests acknowledged and need to know what to expect.
7. Average Time to Resolve
This service desk metric tells you the mean time it takes for a support ticket to be resolved, starting from the time submitted to when it was closed by the agent. Ideally, you want this period to be as short as possible. In addition, tracking these numbers over time can be a helpful way of assessing staffing needs and identifying training improvement opportunities.
8. Agent Utilization
Tracking the utilization of support technicians is an important way to evaluate team productivity and efficiency. Not only is this vital for managing costs per ticket, but it can also influence retention rates. For example, if technicians have workloads that are too high, this can result in higher turnover.
9. Backlog
If your service desk receives too many tickets, that can lead to an extensive backlog. Over time, not only can this reduce response times and hurt customer satisfaction ratings, but it can also overwhelm agents and increase turnover. Tracking and reporting on backlog metrics can help uncover opportunities to reduce workloads and streamline processes, such as creating a self-service portal or knowledge base.
10. Customer Satisfaction
Customer satisfaction (CSAT) is one of the most critical service desk metrics to track and report on. You can send out feedback surveys to your customers, and then track their response rate to calculate the satisfaction percentage.

Whether internal or external, your customers’ satisfaction is related to a variety of other metrics, such as response and resolution times. Regularly analyzing this metric can help you determine both the effectiveness of your agents and the efficiency of your service desk software. To increase end user participation in CSAT surveys, simplify the survey to a simple “yes” or “no” response, and follow up if necessary.
11. Agent Satisfaction
Similar to customer satisfaction, you’ll want to monitor agent satisfaction rates. Agents who are happy in their roles are more likely to go above and beyond to provide a satisfying level of service to customers.
Conversely, if technician satisfaction rates are low, that can increase turnover and ultimately hamper the customer experience. It’s a smart idea to distribute internal surveys and use the responses to calculate satisfaction rates, just as you would with customers.
Conclusion
As we discussed, there are a handful of service desk metrics you can rely on to gain the most relevant and valuable insights. This includes customer-facing numbers such as average response time, average time to resolution, and customer satisfaction, as well as internal ones such as ticket volume, agent utilization, and backlog.
Service desk software can help you enhance workflow efficiency, improve customer service and satisfaction, and boost your support team’s success. To get the most from your chosen tool, it’s essential to track, analyze, and report on the appropriate metrics.