
- What Is Wireshark?
- What Are the Core Features of Wireshark?
- How to Install or Download Wireshark?
- How to Capture and Analyze Data Packets Using Wireshark?
- How to Analyze the Captured Network Packets?
- How Does Wireshark Help in Monitoring Network Performance?
- What Is the Role of Filters in Wireshark?
- How to Use Color-Coding in Wireshark?
- How to View Network Statistics on Wireshark?
- How to Visualize Network Packets With IO Graphs?
- How to Expand Wireshark Capabilities?
With an increase in demand for accessible services and applications, a good network has become more important than ever before. Issues such as packet loss, latency, network downtime, frequent errors, and jitters can hamper the overall user experience. Network monitoring has become a crucial and fundamental requirement for small, medium, and large enterprises. It’s considered the first line of defense when the network server performance begins to deteriorate. Network monitoring tools help teams to assess the availability of network devices, to check the overall health of the network, and troubleshoot performance issues such as bandwidth consumption/utilization and network downtime.
As the market is flooded with a wide variety of network monitoring tools, it becomes challenging to make a decision of choosing a reliable monitoring solution. Different network monitoring tools offer varying degrees of performance and integration capabilities. Some offer fully integrated architecture, whereas others include multiple components such as databases, polling engines, management consoles, and more. It can be confusing for the network administrators to choose the best solution with reliable and effective monitoring features. Therefore, before making a selection, organizations need to consider asking the following questions to the administrators.
- Which devices need monitoring?
- Is there a need to monitor the entire organization’s network or multiple networks?
- How will the network monitoring tool integrate with the existing system?
- What type of core functionalities a tool must-have?
Thorough research needs to be done to determine which tool offers the most beneficial features for the organization in the long run. This post covers one of the most reliable network analyzers available on the market, known as Wireshark. Let’s take a look at what Wireshark is, how it helps in detecting security issues, troubleshooting network errors, debugging protocols, and how the capabilities of Wireshark can be enhanced for advanced network monitoring.

What Is Wireshark?
Wireshark is known as the world’s leading network traffic analyzer. It’s the best tool for system administrators and IT professionals for troubleshooting network errors in real time. Wireshark quickly detects network issues such as latency, suspicious activity, and dropped packets. It can drill down into the traffic and find out the root cause of an issue. Usually, network administrators use Wireshark to resolve latency issues caused by equipment used to route traffic around the world and to monitor data exfiltration attempts against the business operations. Wireshark is a powerful yet free tool requiring extensive knowledge of the networking basics. To make the best use of the tool, administrators need to have a solid understanding of protocols such as TCP/IP and DHCP.
How Does It Work?
Wireshark is a popular open-source tool to capture network packets and convert them into human-readable binary format. It provides every single detail of the organization’s network infrastructure. It consists of devices designed to help measure the ins and outs of the network. The information collected through Wireshark can be utilized for various purposes, such as real-time or offline network analysis, identification of the traffic coming into your network, its frequency, and its latency between specific hops. This helps network administrators generate statistics based on real-time data.
Besides network monitoring, organizations use Wireshark for debugging programs, examining security issues, and learning network protocol internals. Wireshark is designed to efficiently perform packet-related functions and analyze and display the network metrics over the management console.
- Display packet information in the form of graphs, charts, and more
- Capture, export, search, save, and import live data packets
- Build reports based on real-time statistical data
- Filter packets based on the priority
Wireshark also offers a great user-interface as it’s easy to use once the teams get familiar with the basics of capturing packets.
What Are the Core Features of Wireshark?
Wireshark consists of a rich feature set including the following:
- Live capture and offline analysis
- Rich VoIP analysis
- Read/write many different capture file formats
- Capture compressed files (gzip) and decompress them on the fly
- Deep inspection of hundreds of protocols
- Standard three-pane packet browser
- Captured network packets can be browsed via a GUI or TShark utility
- Multi-platform easily ran on Linux, Windows, OS X, and FreeBSD
- Powerful display filters
- Output can be exported to XML, CSV, PostScript, or as a plain text
- Packet list can use coloring rules for quick and intuitive analysis
How to Install or Download Wireshark?
To use Wireshark, the first thing users need to do is to download and install Wireshark on the system. Make sure you download the latest version of the tool directly from the company’s website for a better running experience. Given below are a few steps following which Wireshark can easily be downloaded and installed.
- Install on Mac
To successfully install Wireshark on Mac, users need to download an installer like xquartz. Once the installer is downloaded, open the Terminal and enter the following command:
<% /Applications/Wireshark.app/Contents/Mac0S/Wireshark>
Just wait for Wireshark to start. - Install on Windows
To run Wireshark on Windows, visit the company’s website (Wireshark) and download the program. Once it’s done, simply start the setup process. Install WinPcap as well when it prompts to do so during the installation process. WInPcap is important to install as it helps in capturing live network traffic, and without it, users can only access the already saved capture files. To install WinPcap, select the Install WinPcap box.
- Install on Unix
Installation of Wireshark on Unix involves the downloading of a couple of tools such as Glib, GTK+, and libcap. Both Glib and GTK+ can be installed from the same toolkit. Once all these three supporting tools, along with Wireshark, are downloaded, Wireshark can be extracted from the tar file.
gzip -d wireshark-1.2-tar.gztar xvf wireshark-1.2-tar
Change the tar file to Wireshark directory and enter the following commands:./configure
make
make install
Start the Wireshark on the Unix system.
How to Capture and Analyze Data Packets Using Wireshark?
One of the major functions of Wireshark is to capture data packets for conducting detailed network analysis. However, it can be tricky for beginners who aren’t familiar with the steps involved. There are majorly three important steps:
- Get access to administrative privileges to start capturing the real-time data directly the device
- Choose the right network interface to capture packet data
- Choose the right location within the network to capture packet data
After following the above steps, the Wireshark is ready to capture packets. Usually, there are two capturing modes: promiscuous and monitor. Promiscuous mode sets the network interface to capture only the packets for which it’s assigned. Monitor mode is used by Unix/Linux systems and sets the wireless interface to capture as much of the network as it can. The data gathered while capturing packets is displayed in a human-readable format, so it’s easier to grasp. As Wireshark breaks the captured packets into a readable format, users can perform various other tasks such as select filters to find precise information and color code the crucial information. With Wireshark, administrators can also monitor multiple networks simultaneously.
Usually, promiscuous mode is used by system administrators to get a bird’s-eye view of the network packets transfer. On disabling this mode, only a small snapshot of the network is provided, which isn’t enough to conduct quality analysis. The promiscuous mode can easily be activated by clicking on the capture options provided in the dialog box. However, promiscuous mode isn’t available on every software or operating system. Therefore, users need to cross confirm about software compatibility either by visiting the Wireshark’s website or using the Device manager to check the settings (in case you’re a Windows user).
How to Analyze the Captured Network Packets?
Once the network data is captured, the list of network packets is displayed on the centralized management console or the dashboard. The screen consists of three panes: packet list, packet bytes, and packet details. However, to get important information on individual packets, users need to click on any of the panes mentioned above.
Packet List
The packet list pane consists of browsable captured network packets based on the timestamp to show exactly when the packet was captured, the packet’s protocol name, the source and destination of the packet, and support information.
Packet Details
Packet details pane provides information about the chosen packet. Users can expand each section and apply filters to get information about specific items.
Packet Bytes
Packet bytes pane consists of the internal data of the packet the user selects. The data is displayed in a hexadecimal format by default.
How Does Wireshark Help in Monitoring Network Performance?
Once the network packets are captured, the next step is to monitor and analyze them. Wireshark is a great tool to analyze and monitor the organization’s active network. Before doing this, it’s important to close down all the active applications on the network to reduce traffic, which helps in giving a clear picture of the network. Turning off all the applications won’t result in packet loss; in fact, the sending and receiving of packets is still an ongoing process.
However, conceptualizing the huge amount of data altogether isn’t easier. Therefore, Wireshark breaks these components into different forms to see what’s going on within the network. To help users quickly understand and analyze the data coming in, Wireshark uses color coding, filters, network statistics to segregate the network data.
What Is the Role of Filters in Wireshark?
Filters are beneficial when analyzing large files and a considerable amount of data. Filters help administrators find specific network data out of thousands of packets traveling through the network every second. Wireshark uses the two most common types of filters: Capture and Display, to segregate data based on their relevance. The capture filter gathers the live-monitoring data by reducing the size of the incoming packets. This helps in filtering out the non-essential packets during live capturing. However, capture filters are set before the filter process begins and cannot be modified once the process has started. Display filters, on the other hand, are used to filter the already recorded data.
How to Use Color-Coding in Wireshark?
Color coding is done to highlight the different packets based on certain factors. This helps users to identify packets based on colors. For instance, the UDP is denoted by light blue, ICMP with light pink, TCP traffic by light purple, and the packets with errors are highlighted with black. Wireshark’s default settings use twenty different colors to indicate various parameters. Users may modify, edit, add, or delete the settings as per their requirements. Colorization can also be disabled by turning off the Colorize Packet List field.
How to View Network Statistics on Wireshark?
Statistical data is beneficial in providing in-depth information about your network. To view those stats, click on the statistics drop-down menu providing metrics ranging from timing and size to plotting graphs and charts. Users can also apply a display filter to narrow down the list of options and find out the relevant information. The drop-down statistics menu displays the following metrics:
- Conversations: Displays the conversations of two endpoints like two different IP addresses
- Endpoints: Displays the list of endpoints
- IO Graphs: Displays all graphs
- Protocol Hierarchy: Displays the table of captured packets
- RTP_statistics: Help users to save RTP audio stream content to Au-file
- Multicast Stream: Measures the speed of other components by identifying the multicast streams
- TcpPduTime: The time taken to transmit data from Data Protocol Unit
- VoIP_Calls: The number of VolP calls received from live captures
- Service Response Time: The time taken by the network to respond to a request
How to Visualize Network Packets Wfith IO Graphs?
Data packets or the network traffic can be represented in a visual format known as IO graphs. Users can view IO graphs by clicking on the statistics menu and selecting the IP graph tab. Once the graph window opens, users can view the data they wish for by configuring the graph settings accordingly. Due to Wireshark’s default settings, only one graph is displayed at a time. If users want to activate more graphs simultaneously, simply enable them. Moreover, users can also customize the graphs using filters and color codes to find out the relevant information for the purpose. Users can also modify the graph structure from the style column and can choose any of them: Line, Dot, Impulse, Fbar. Users can also not only adjust the style of the graphs but can also interact with the X and Y axis metrics of the graphs. Once the settings are done, the graphs can be stored in a file format for future purposes.
How to Expand Wireshark Capabilities?
Undoubtedly, Wireshark is a great packet sniffer, but it lacks a few advancements when it comes to meet the growing needs of network monitoring. Wireshark’s monitoring capabilities can be improved using complementary tools such as SolarWinds® Response Time Viewer for Wireshark, Show Traffic, Cloudshark, and NetworkMiner. Outlined below are the features, capabilities, functions of these tools, and how they help in enhancing the network monitoring capabilities of Wireshark.
SolarWinds Network Performance Monitor
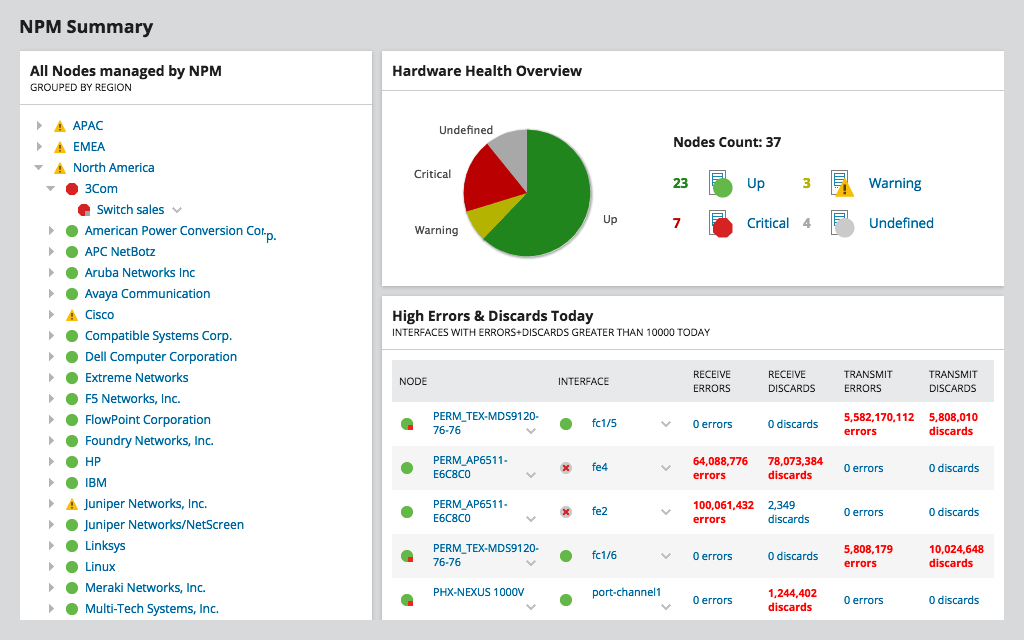
SolarWinds Network Performance Monitor (NPM) is a powerful network monitoring software used to detect, diagnose, and resolve network issues and outages. The tool is specially designed for advanced network troubleshooting for on-premises, hybrid, and cloud services, and detects issues with its hop-by-hop analysis. It not only helps to make the network scalable but also secure. NPM is also capable of reducing downtime resulting in improved operational efficiency, network availability, and high-performing applications. It offers out-of-the-box features including intuitive dashboards, advanced alerting systems, custom reporting, packet analysis, and more. Besides hop-by-hop analysis, NPM offers availability monitoring, cross-stack network data correlation, customizable topology, network discovery, mapping capabilities, packet capture analysis, drag-and-discover network performance charts, statistical network performance baselines, and hardware Health Monitoring. With NPM, areas with weak signals or network dead zones can be identified quickly using Wi-Fi heat maps. Try it out with a free, fully-functional trial.
SolarWinds Response Time Viewer for Wireshark

SolarWinds Response Time Viewer for Wireshark allows users to detect and analyze Wireshark’s packet captures and troubleshoot network performance outages in real-time. It can perform multiple tasks such as identify over 1200 applications, calculate their network response time, display data and transaction value, critical path visualization with Netpath, and wireless network monitoring and management. Evaluating these parameters helps users determine network flaws and faults.
Cloudshark

Cloudshark is a platform designed to display network capture files directly in the browser without the need for desktop applications or tools. Simply upload, email, or link the captures files and get the results. It helps to resolve network issues faster and flawlessly. Besides, it includes features such as drag-and-drop capture files, drop-box-like activity, allows sharing of links with co-workers, and offers advanced analysis.
Sysdig
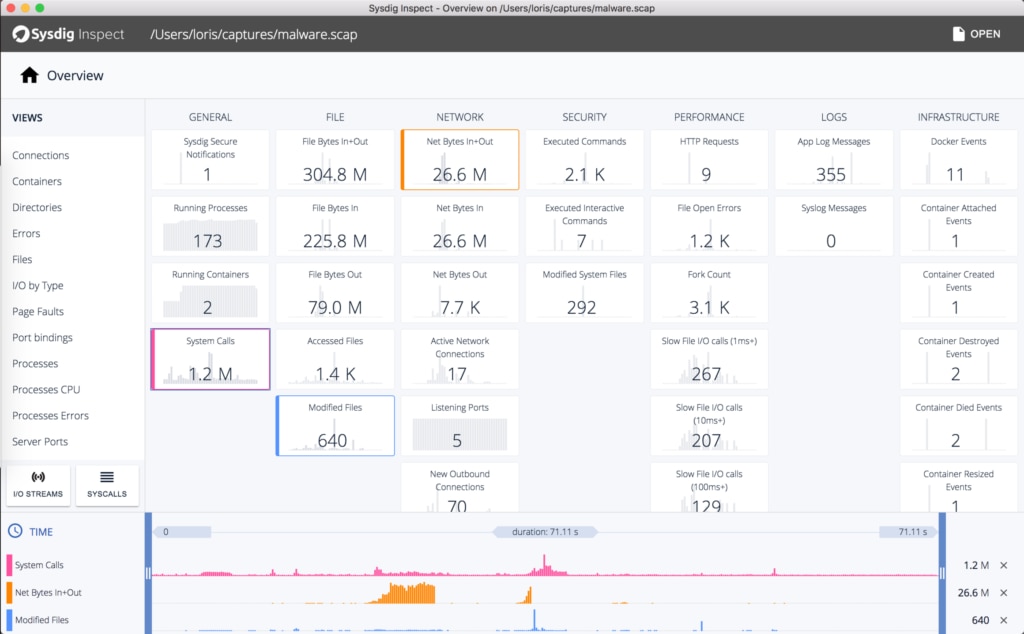
Sysdig is a powerful, cross-platform, and open-source flexible network monitoring system designed specifically for Linux. It also works for Windows and Mac OSX but with limited functionalities such as inspection, debugging, and system analysis. Sysdig uses various monitoring and troubleshooting tools for Linux system performance, such as:
- Strace (for discovering system calls)
- htop (for real-time process monitoring)
- iftop (for real-time bandwidth monitoring)
- netstat (for network connection monitoring)
- tcpdump (for raw network traffic monitoring)
- Isof (to know the process used to view the opened files)
Sysdig integrates all the tools mentioned above and offers them in a single program. Users can easily capture, filter, save, modify, track, and examine network traffic and the real behavior of Linux systems. Sysdig features include:
- Orchestrator integrations
- Intuitive dashboards
- Cloud-platform integrations
- Application integrations
- Alerting and event management
- Vulnerability management
- Compliance/Audit report generation
- Topology maps
- Runtime error detection
- Capture files
- Single sign-on
Debooke

Debooke is one of the simplest and most powerful network monitoring and traffic analyzer tools for macOS. The tool allows users to intercept and monitor the network traffic of any device in the same subnet. It helps to capture data network packet data from any device such as a mobile, printer, Mac, TV, and more without using a proxy. Features of Debooke:
- Keep track of Wi-Fi bandwidth use and consumption
- Help with network monitoring and in-depth analysis
- Display the Wi-Fi clients and the APIs to which they’re associated
- Scan IP, LAN to keep track of all the active and connected devices
Final Thoughts
Wireshark is a simple, yet versatile and powerful network monitoring tool. It’s easy to use and easy to learn. Besides monitoring, Wireshark offers additional network analysis features such as:
- IO graphs to help users to understand their network visually
- Color coding to highlight different parameters or network information for future use
- Filters to get the relevant information required for the purpose
However, for the new users who are willing to try Wireshark, it’s advisable to do some additional research and get detailed information on Wireshark by visiting the website. For existing users who are looking for more advanced network monitoring and analytical features and want to create their protocol dissectors, try using the external plugins and supporting programs highlighted above.
SolarWinds Network Performance Monitor and Response Time Viewer for Wireshark are professional tools and work amazingly. They can not only identify and troubleshoot network issues in real-time but also perform multiple tasks simultaneously, such as display essential data, calculate network response time, and more. These tools increase the depth of the network analysis efforts dramatically.