
One of the most important aspects of IT operations in organizations is maintaining constant connectivity and productivity. IT teams have to ensure the proper distribution and management of network speed and the quality of service (QoS) between different applications and users. In this respect, network latency is an important metric.
There is a wide variety of latency testing tools available in the market. These tools can help you track and analyze a vast amount of network-specific information and metrics related to network performance. Some tools will simply help you measure latency, while others can give you a detailed analysis of bandwidth utilization.
In this article, we’ll list the top network latency testing tools and explore how they can help you monitor and optimize your network for reliable performance.
Top 9 Network Latency Testing Tools
- Network Performance Monitor
- Paessler Router Traffic Grapher (PRTG)
- NetScanTools
- NirSoft NetworkLatencyView Tool
- PingPlotter
- NetFlow Traffic Analyzer
- Network Bandwidth Analyzer Pack
- Engineer’s Toolset
- VoIP & Network Quality Manager
1. Network Performance Monitor
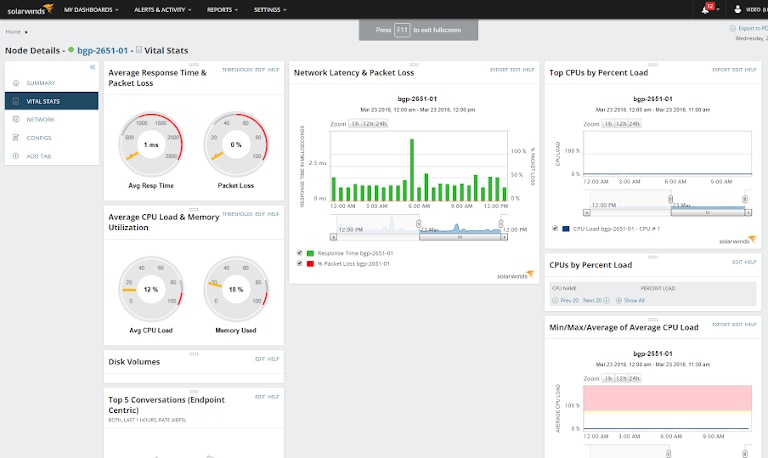
SolarWinds® Network Performance Monitor (NPM), the company’s flagship product, is an excellent tool to monitor and manage the entire network infrastructure, which covers all devices, applications, and users in a network. This tool offers visual NetFlow analysis and includes latency testing features. With this tool, you can check on all devices on the network, discover slow segments, and get recommendations to fix problems. With NPM, admins can spot congestion on ports and identify paths and servers with overloaded CPUs. They can also get alerts to resolve networking issues. Furthermore, it’s easy to get started with NPM, as SolarWinds offers a 30-day fully functional free trial for evaluation.
2. Paessler Router Traffic Grapher (PRTG)
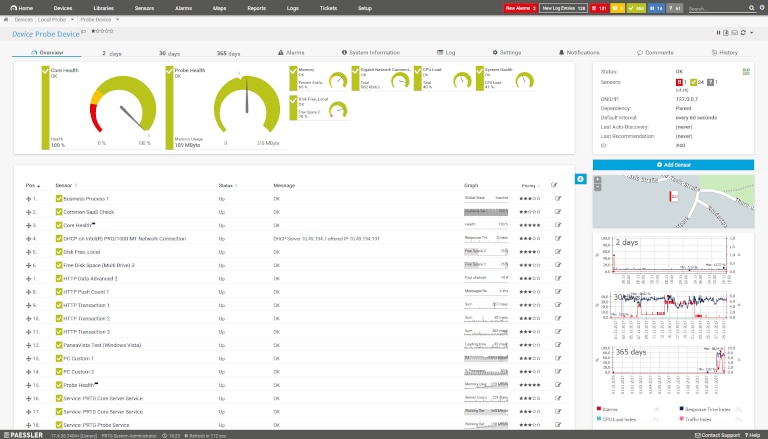
Paessler Router Traffic Grapher (PRTG) is another comprehensive bandwidth monitoring tool that allows admins to view network patterns and consolidate alerts at a centralized location. The auto-discovery feature of this tool helps admins scan the entire network and discover new systems or changes to the network. It’s easy to view the performance of your network in real-time with color-coded maps and a robust dashboard system.
3. NetScanTools

NetScanTools is one of the most cost-effective and affordable sets of 50 network management tools and utilities available for Windows-based systems. Available in Pro, Basic, and LE packages, NetScanTools collects information automatically and presents it using automated reports for a detailed view.
4. NirSoft NetworkLatencyView Tool

The NetworkLatencyView tool from NirSoft works on any version of Windows and listens to the new TCP connections on your system. This tool calculates the latency for every new TCP connection and allows admins to export the latency information into text files as well as .csv, .html, and .xml files. The tool also offers geographical information for every destination IP address. You can get additional information about the destination IP address by integrating it with the IPNetInfo utility.
5. PingPlotter

Available in Free, Standard, and Professional editions, the PingPlotter tool can monitor and troubleshoot complex network infrastructures with its bundle of tools. Every version uses Ping and Traceroute, and they all present the results in a graphical format. The tool collects information about app servers, web domains, and test routes. It displays this information in easy-to-understand graphs and helps you take immediate action without much hassle.
6. NetFlow Traffic Analyzer

SolarWinds NetFlow Traffic Analyzer (NTA) is another SolarWinds product more focused on monitoring network bandwidth and analyzing network traffic. It offers a web-based interface to monitor the flow of network traffic. NTA allows admins to discover traffic patterns and provides greater visibility into the abrupt traffic flow. This tool collects data and presents it in a visual form to examine high traffic volumes between network devices. You can learn more about NTA or get a free subscription for 30 days here.
7. Network Bandwidth Analyzer Pack

SolarWinds Network Bandwidth Analyzer Pack (BAP) is a comprehensive network bandwidth analysis and performance monitoring solution combining the capabilities of both SolarWinds Network Performance Monitor and SolarWinds NetFlow Traffic Analyzer. The combined subscription of these tools helps you detect, diagnose, and resolve network issues by using a wide range of features, including packet sniffing, monitoring SNMP-enabled devices, and NetFlow analysis. With the help of BAP, admins can allocate bandwidth to applications according to their organizational needs and troubleshoot network issues leading to latency, jitters, CPU overloads, etc. You can try BAP for free here.
8. Engineer’s Toolset

SolarWinds Engineer’s Toolset™ (ETS) consists of more than 60 tools designed to help you monitor and analyze the overall health of the network and get real-time alerts about it. A range of network scanning tools allows you to diagnose network issues and take remedial actions. You can use the Response Time Monitor to track the availability of all the devices in your environment and obtain latency information in a tabulated form. The Memory Monitor helps you view the total memory available along with the memory utilization of network devices in real-time. You can also use the CPU Monitor to track the CPU load for multiple devices in a tabular form. The CPU monitor can also send timely alerts when a peak load level for a device is recorded.
With these tools, you can also perform auto-discovery to keep track of existing and newly added devices. You can also manage logs and configurations for different devices, including SNMP traps. Moreover, it’s easy to get started with SolarWinds ETS, as installation typically takes only a few minutes. You can get more information and start a free trial here.
9. VoIP & Network Quality Manager

SolarWinds VoIP & Network Quality Manager (VNQM) is designed to provide deep insight into the quality of service (QoS) metrics of Voice Over Internet Protocol (VoIP) calls. This tool allows you to view the call path of VoIP calls from the initiation to the end of the call. It records metadata from VoIP calls, such as call origin and destination IPs, latency, packet loss, call termination cause, and more. These records can help troubleshoot VoIP call issues and spot areas leading to poor performance in your network. This tool can also automatically discover Cisco IP SLA-enabled network devices. Furthermore, it takes only a few clicks to deploy SolarWinds VoIP & Network Quality Manager. You can learn more about the tool’s features and capabilities or download a free trial here.