
Based on Model-View architecture, Django offers the convenience of developing, releasing, and consistently maintaining the applications. Django is a Python-based web framework capable of running on most server operating systems. It prioritizes rapid development and supports various web content formats, such as HTML and XML. Monitoring a Django web application is critical for developers to speed up the development lifecycle and accommodate code audits at an accelerated rate. The right Django monitoring tool automates application performance monitoring, streamlines metrics traction, visualizes application bottlenecks, and accelerates troubleshooting. Besides, effective Django monitoring helps developers understand the application performance issues related to web server overload, databases, or network bandwidth, and expedite resolution.
Let’s look at some of the key Django monitoring tools designed to help developers quickly build web applications pragmatically with clean code.
SolarWinds AppOptics
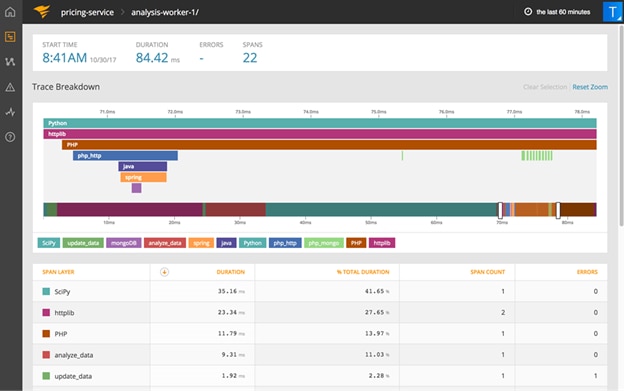
SolarWinds® AppOptics™ provides visibility across the entire stack and gives a unified view of web servers, databases, and services to analyze application performance. Visualization helps simplify application monitoring by simultaneously displaying the impact of other elements such as web server overload on Django performance. Users can track Django metrics across the system to get ahead of issues even before they turn into performance roadblocks using the dashboard offered by AppOptics. Intuitive UI and comprehensive documentation ensure quick setup by guiding users to get up and running in minutes. Moreover, its distributed tracing feature helps developers or system administrators track the service response time on the front end and back end. It also enables faster troubleshooting by notifying the changes in traffic patterns in a fraction of the time it usually takes.
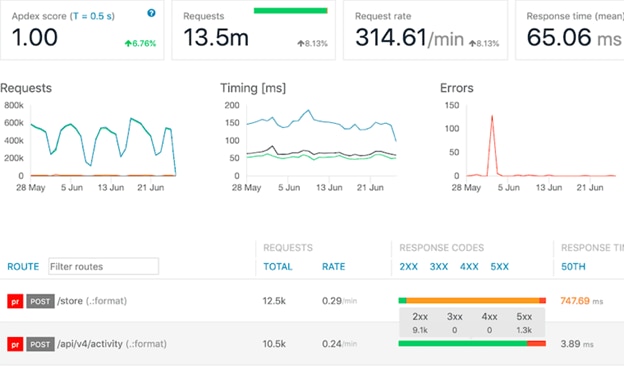
Atatus

© 2020 NamLabs Technologies Pvt Ltd. All rights reserved
Atatus allows users to view real-time data from multiple Django applications in one place. It’s built to help developers and other stakeholders identify areas impacting overall Django performance by visualizing critical information such as response time, crash rate, and database performance. Drilled-down reports from Atatus are useful for carrying out root-cause analysis to rapidly spot Django performance issues and errors at their source for faster resolution. It supports smart alerts via email or webhooks to notify users of any errors or scenarios when an error occurs frequently. Atatus also supports integration with messaging services such as Slack and PagerDuty to send alerts.
Airbrake
Airbrake provides a snapshot of Django applications to measure and track useful performance metrics. It helps identify routes with slow or error-prone performance and analyze metrics with granularity to assess time spent in the database, cache, external requests, and more. Airbrake supports real-time alerts via email, Slack, or webhooks to inform users about any hurdles beforehand. It offers integration with third-party apps and various webhooks such as GitHub and Trello.
Scout
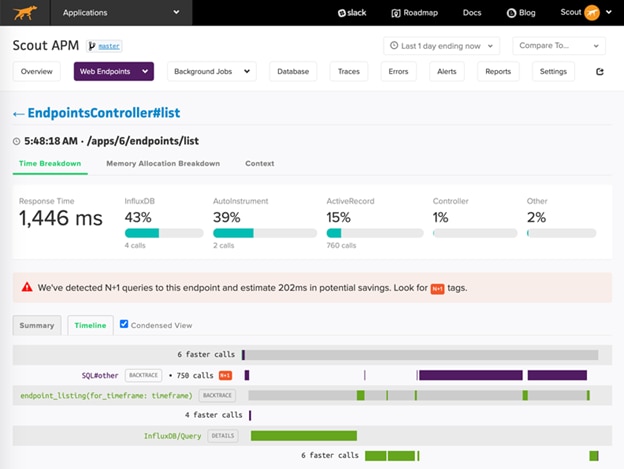
Scout helps users get a complete view of Django applications by allowing monitoring of every single web request. It also helps identify capacity problems by measuring request time and checking the load balancer queue for high queue time. Besides, Scout supports GitHub integration and pinpoints the exact codes responsible for slow response times. Its enhanced query monitoring for databases empowers users to track and detect expensive database queries to optimize performance. It also offers memory bloat detection functionality and embedded charts for a granular view of health metrics.
New Relic
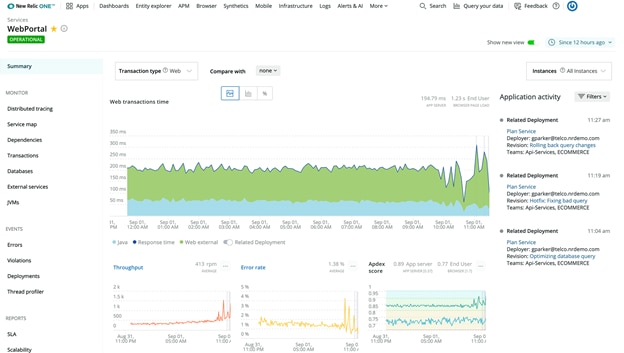
New Relic provides complete transaction performance monitoring for Django web applications, and its trace details uncover the time spent in the database, middleware, and view handler. It automatically captures slow queries and reports the underlying explain plans to spot missing indexes and track improvements easily. New Relic also prevents run-time exceptions and reports such exceptions with their stack traces to help developers fix errors otherwise unnoticed in the production environment. Moreover, effective capacity planning is possible with New Relic as it supports effective visualization to analyze the use of the different workers and the available CPU capacity.
Conclusion
An ideal Django performance monitoring tool provides critical insights into the overall health of Django applications and infrastructure. It helps developers deep-dive into the data for faster troubleshooting and a better user experience. However, choosing the right Django monitoring tool can be a daunting task. We recommend getting hands-on experience with AppOptics full-featured 30 days free trial to evaluate and see for yourself how it fulfills your Django monitoring requirements. AppOptics provides a broad performance overview by tracking infrastructure, application, and business metrics in a unified way to quickly identify problem areas.